
Basic Concept
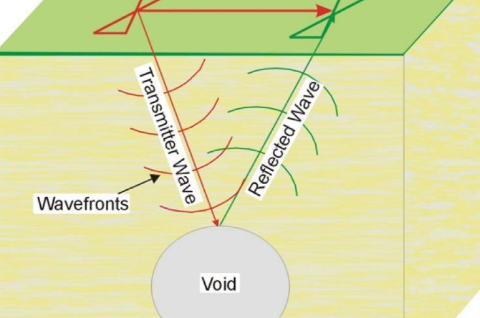
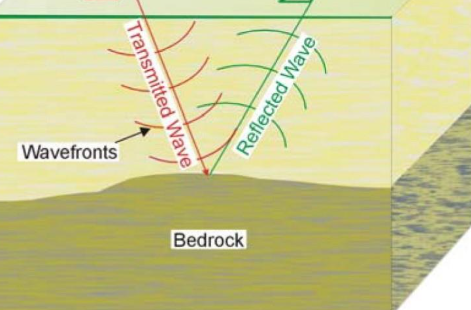
Ground-penetrating radar (GPR) uses high-frequency electromagnetic pulses transmitted from a radar antenna to image the subsurface. The transmitted radar pulses are reflected from various interfaces within the ground, and the return signal is detected by the radar receiver. Reflecting interfaces include, but are not limited to, soil horizons, groundwater, soil/rock interfaces, buried structures/objects, or any other interface possessing a contrast that is detectable by the GPR.
Typical objectives of GPR surveys are to map near-surface interfaces, or to identify potential buried objects such as underground storage tanks or pipes in the subsurface. The method is most useful for detecting changes in the geometry of subsurface interfaces, structures, or objects. A contrast in physical properties must be present to allow for detection.
Limitations
Clay content and water/moisture or air content play an important role in limiting the propagation of the GPR signal. These conditions can affect the GPR signal propagation that cannot be resolved, limiting the imaging depth and interpretation. Surfaces treatments such as asphalt, concrete, and gravel can also be a source of interference.
Measurements and Relevant Physical Properties
GPR surveys measure propagation velocities of the electromagnetic pulses being reflected from materials with differing dielectric properties. Large variations in propagation velocity and dielectric constant are strongly related to the success (target detection) or failure (insufficient signal penetration/imaging depth) for surveys. A contrast in physical properties must be present to allow for detection.
Materials with the lowest dielectric constant generally allow for the greatest depth of investigation. GPR works best in electrically resistive environments such as deep sequences of unsaturated sands and is least effective in environments with saturated clay.
Data Acquisition
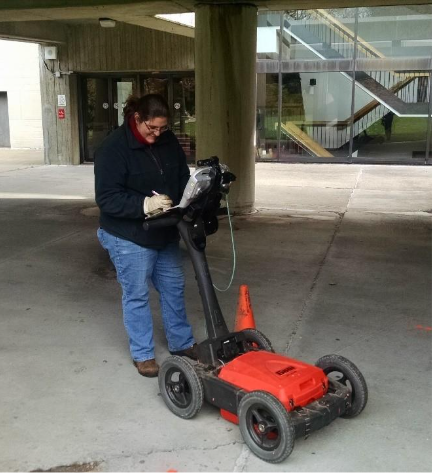
GPR surveys typically involve the common-offset configuration where an antenna pair (transmit and receive antennas) are housed within the same case and typically mounted on a cart. The cart is moved along a transect while the system transmits radar pulses that last anywhere from 10 to more than a thousand nanoseconds and are within the frequency range of 80 to 2,700 MHz. A radar signal is transmitted downward into the ground by an antenna that is on or near (typically within ½ ft of) the ground surface. When the signal encounters an object or an interface that has contrasting electrical properties, the GPR signal is reflected to the surface and recorded by the GPR unit. The GPR system pulses several times per second, which allows for real-time profile imaging.
GPR uses electromagnetic wavelengths that tend to produce good resolution in the upper 2-3 meters, depending on site conditions and subsurface material(s). Conditions such as increased moisture content/groundwater or clay content tend to weaken (attenuate) the GPR signal and decrease imaging depth. Typically, lower frequency provides greater depth of investigation but lower resolution, and inversely, higher frequency provides less depth of investigation but higher resolution. The returning signal amplitude is measured over time, and signal traces are displayed in cross-section on a digital handheld recorder and stored for future analysis.
Separate transmitter and receiver antennas can also be used for surficial work and borehole work. For example, a common-midpoint survey involves symmetrically moving two antennas away from a point and allows for detailed analysis of the vertical velocity structure. Separate antennas can also be used where the primary focus is on the transmission of waves through materials (between boreholes).
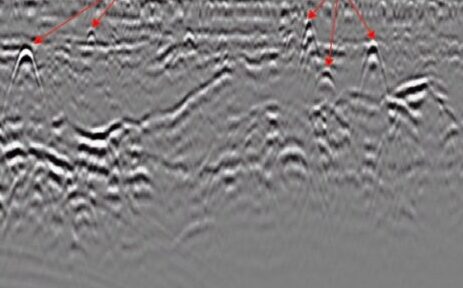
GPR records are recorded digitally and can be displayed as radargram or variable area record sections (see below). Both negative and positive GPR amplitudes in excess of the threshold appear as darker/colored portions of the record. This visual presentation is adequate for most tasks where target detection is the object, and post-survey processing is not anticipated. Such targets can be directly marked on the ground in the field at the time of the survey.
Data Processing
Where the data set is too large to interpret in real-time, or where further processing is required, there are a series of processing steps that can be followed to improve the interpretability of the data. These recommended basic processing stages usually include, but are not limited to range gain, band-pass filtering, frequency filtering, background removal, and if necessary, horizontal scaling. Additional steps that might be advantageous, depending on the type of survey and target of interest are migration, smoothing, stacking, and resampling of the processed digital data. While each of these steps can be important, care needs to be taken not to reduce the quality of the data by over processing.
Data Interpretation
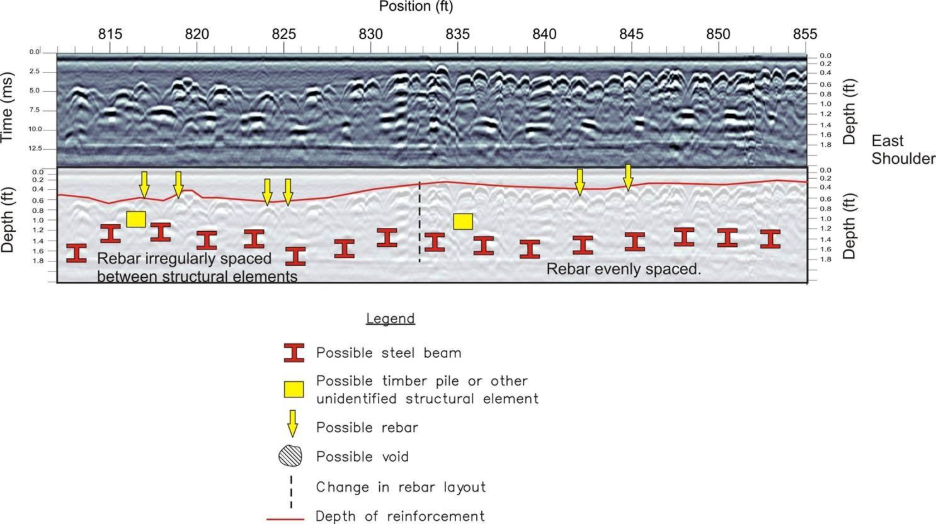
Interpretation of GPR data can be quite simple or very complex depending on the target of interest. For example, GPR surveys conducted for utility location or other linear features are typically straightforward as is the interpretation. However, surveys conducted to map stratigraphic units often require higher level of processing and more interpretation as the differences in GPR reflections for stratigraphic units can be more subtle and the determination of the depths/elevations of the units can be difficult due to the changing propagation velocities in the overlying materials.