
Basic Concept
The Seismic Refraction Method is a non-destructive seismic method to evaluate the compressional wave (Vp) or shear wave (Vs) velocity distribution and structure for overburden soil and bedrock.
In a seismic refraction survey, one measures the time the fastest wave takes to travel from a source point to receivers (referred to as first arrivals). In the schematic image below, the direct wave (travelling at the speed of V1) will arrive first at geophones close to the source. However, at geophones further from the source, refracted waves may arrive before the direct wave since they are travelling at a higher speed at depth (travelling at the speed of V2 at the boundary between the two materials).
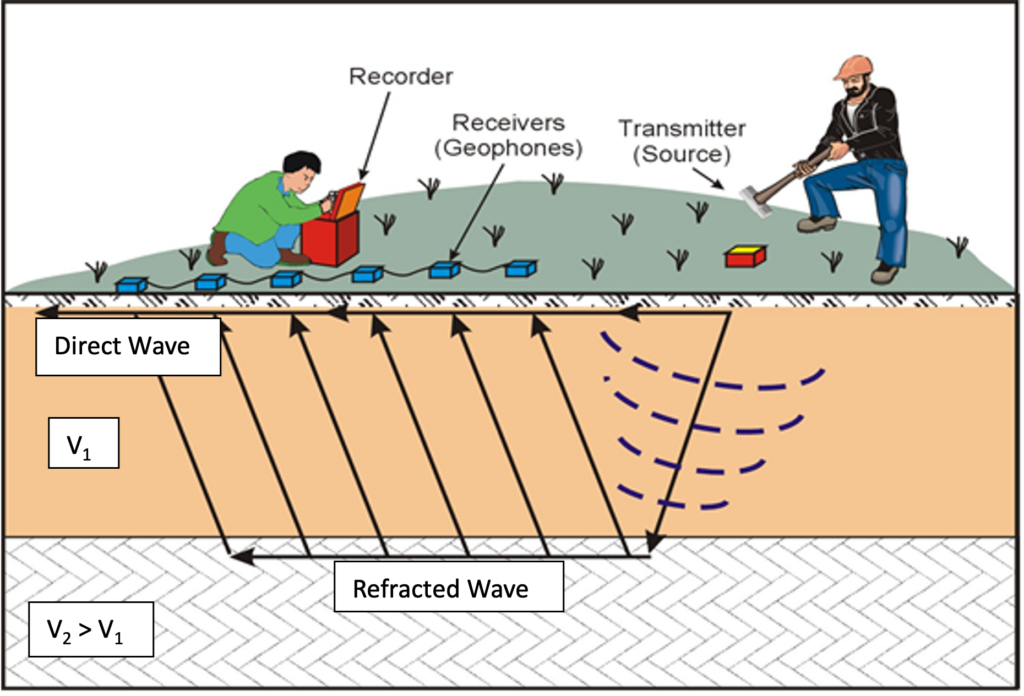
Compressional wave (P-wave) refraction surveys are more common than shear wave (S-wave) surveys since P-wave setups are faster. P-waves are easier to generate while giving reliable subsurface velocity models. Shear wave (S-wave) surveys are typically only conducted if shear properties are specifically required (e.g., for geotechnical or earthquake engineering).
Refraction interfaces correlate with real physical boundaries in the ground, such as the soil-to-bedrock boundary and weathered bedrock-to-competent bedrock boundary.
Limitations
- Quality seismic refraction data can be hard to collect at sites with urban noise (e.g. around earth moving/compacting/vibrating equipment, traffic, and industrial noise).
- Coupling the geophones to the ground can be challenging, especially at sites lacking firm cohesive soils, as poor coupling leads to weak and/or noisy signals.
- Soft materials may attenuate the seismic energy quickly, making it hard to detect signals from greater depths.
- Modeling ambiguity can be introduced due to the existence of low-velocity layers, and velocity reversals cannot be detected by the method, as the technique assumes increasing velocity with depth
- The method requires multiple impacts, long geophone arrays and multiple shots, making it relatively slow, labor-intensive, and costly, especially for large or deep surveys.
Measurements and Relevant Physical Properties
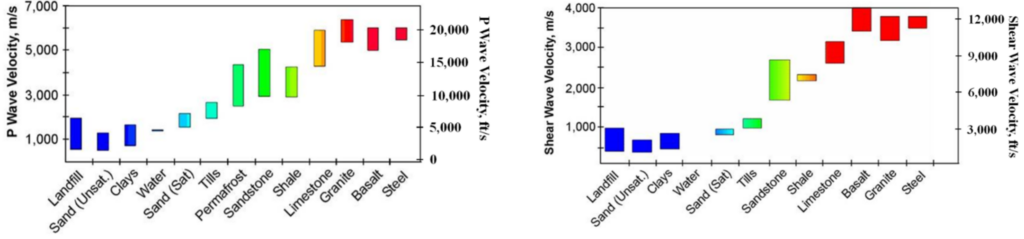
A seismic refraction survey results in the determination of seismic velocities of subsurface materials. The seismic velocity of a geological material tells us a great deal about the mechanical state of the subsurface. It reflects the material’s composition, porosity, fluid content, and degree of hardness, compaction or cementation. For example, loose unconsolidated soils, fill, and voids will exhibit low velocity, sedimentary and weathered rock will exhibit moderate velocity, while crystalline unweathered rock will exhibit high velocity.
The graphs below show typical Vp and Vs for some geological and manmade materials.
Data Acquisition
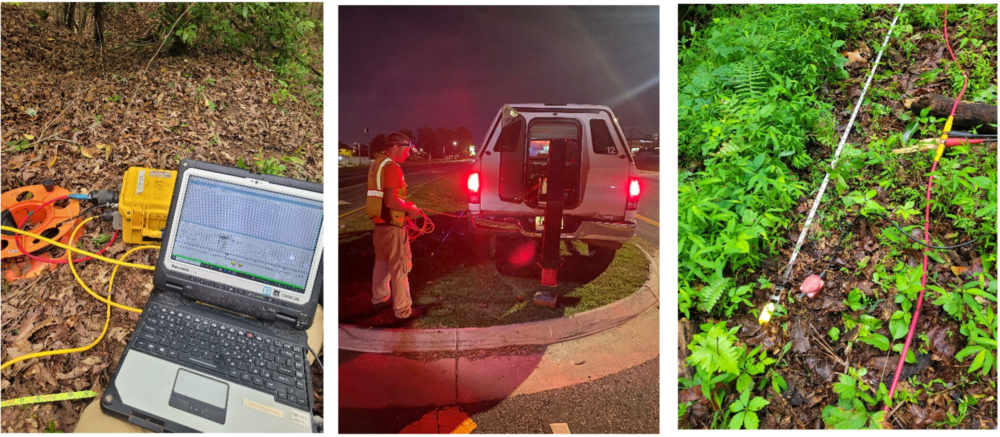
Seismic refraction surveys are accomplished by planting an array of geophones on the ground surface and measuring the travel-time of seismic waves created by a source (e.g. hammer blows, weight drops, or explosives). For generating S-waves, specialized sources are required because S-waves involve horizontal particle motion, unlike compressional waves (P-waves), which propagate vertically. The most common seismic sources for S-wave generation include horizontal hammer, weight drop with horizontal coupling, and shear-wave mode Vibroseis.
Geophones can be placed in soil using geophones spikes or on pavement using geophone plates. Most geophones have vertical, single-axis response to receive the incoming waveform from beneath the surface. Some geophones have horizontal-axis response for S-wave assessments. Triaxial phones, capable of measuring absolute response, are used in specialized surveys.The geophones are connected to a multi-channel seismograph via a seismic cable where each channel is dedicated to recording vibrations from one receiver.
The seismograph digitizes geophone signals, may store data, and may provide some level of data display. Seismographs without data viewing or storage capabilities are connected to field computers, which are used for setting data collection parameters, data viewing and storage.
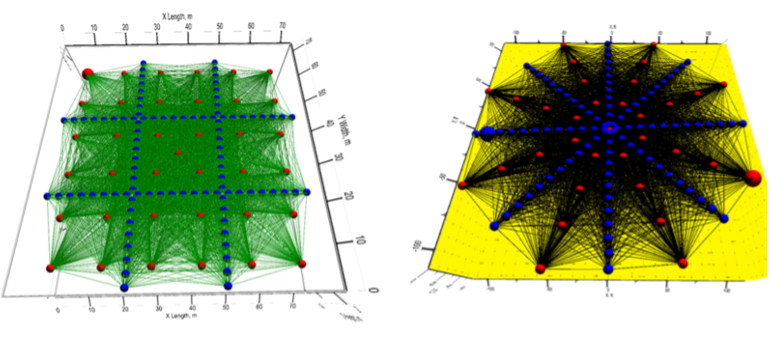
At sites with complex geology and target geometry, a 3D survey may be beneficial. The figure below illustrates two example field setups for 3D seismic refraction surveys. A receiver array, comprised of a multiple number of receivers, is deployed with a survey spacing and orientation designed to meet the survey objectives and provide sufficient subsurface coverage over the depth and area of interest.
Data Processing
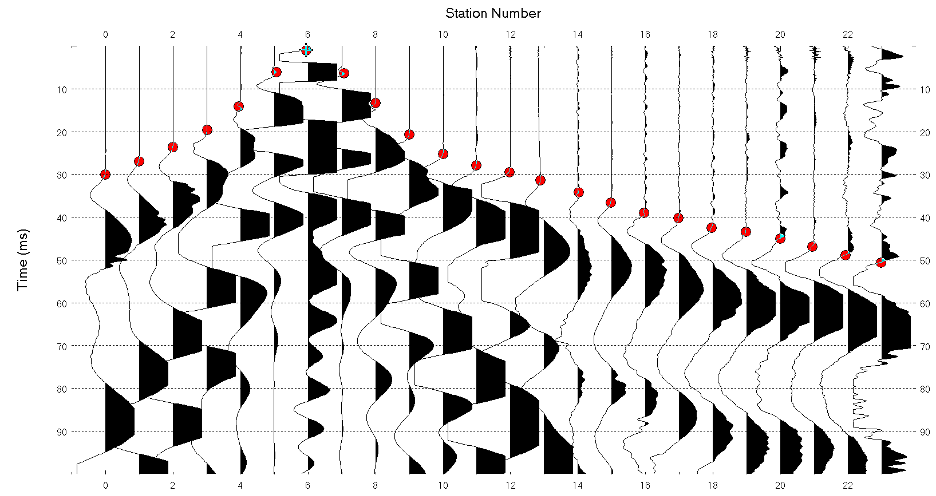
There are multiple commercially available software packages for processing seismic refraction data. The first step in processing/interpreting refraction seismic data is to pick the arrival times of the earliest seismic signal. A plot is then made showing the arrival times against the distance between the shot (creation of energy by the source) and geophone.
At geophones positioned close to the seismic source, the first arrivals are typically direct waves. However, beyond a critical distance from the source, the first arrivals are refracted waves due to the faster relative velocity of the waves traveling in higher velocity materials. The figure below represents a typical first arrival picking and travel time curve. The geophone distance from source is represented by the Station Numbers, and the wave arrival times are indicated by the position on the y-axis.
Data Interpretation
Based on the trends in seismic velocity observed in the data collected, the types of materials or geological features and their thicknesses may be interpreted using seismic refraction data. Interpretation is best completed using available geological and geotechnical information such as boring logs and cone penetration test (CPT) data to verify the subsurface materials present and their properties.
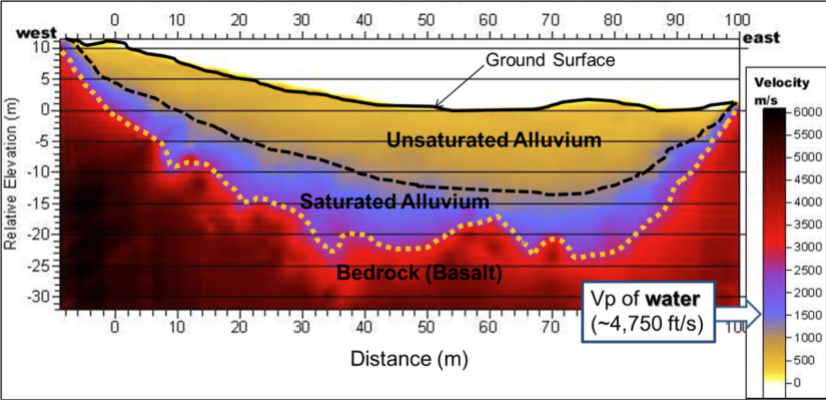
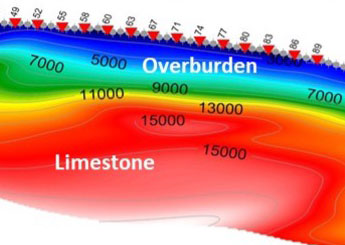
In recent years, seismic refraction tomography (SRT) has gained popularity and is now the most common method for interpreting seismic refraction data. The main benefit with SRT is that it allows for obtaining a picture of the velocity distribution in the subsurface highlighting continuous lateral and vertical changes in velocity rather than assuming a layered model.
The SRT technique involves an automated search for the minimum deviation between the measurements made on the ground and the “virtual” measurements of a synthetic model through an iterative computer process. An example of a SRT velocity model with interpretations is shown in the figure below.
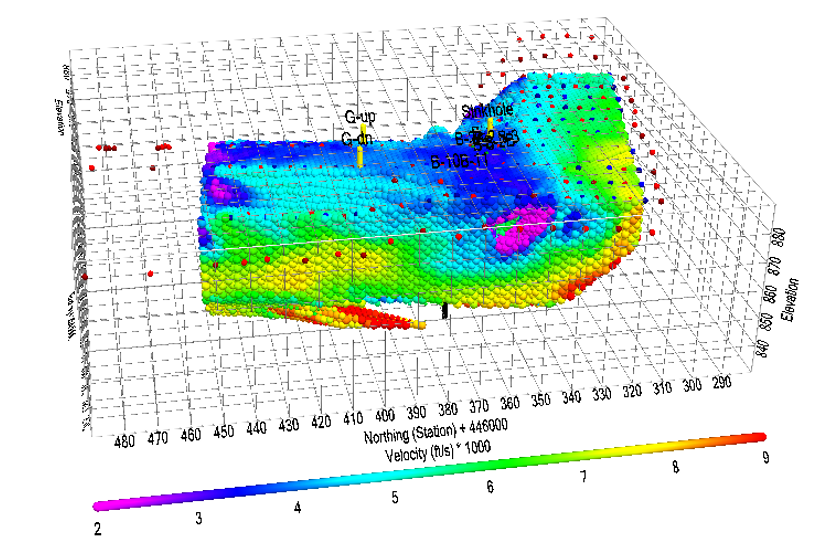
The figure below shows an example of a 3D SRT karst investigation used for geotechnical site analysis of an embankment dam and analyzed using the SRT method. Areas with anomalously low velocity (shown in purple) indicate potential voids in limestone bedrock.
Applications
Mapping Voids, Sinkholes, Abandoned Mines and Other Cavities
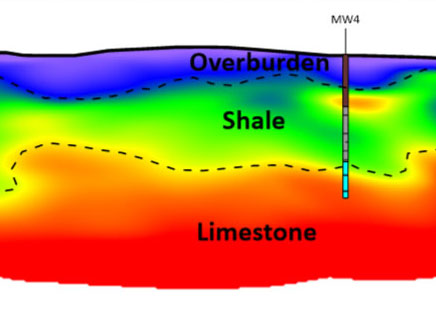
Soil and Rock Characterization
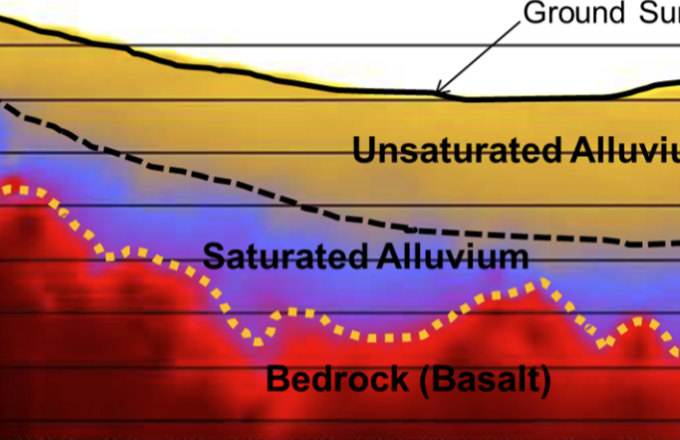
Mapping Groundwater Surface and Flow

Determining Engineering Properties of the Subsurface
Determining the Rippability of Rocks