
Basic Concept
Cross borehole seismic tomography is a variation on crosshole seismic testing. Contrary to other downhole seismic methods such as Crosshole Seismic Testing and Parallel Seismic, more than one receiver is deployed in a borehole for each source position in the other borehole. Also, more advanced imaging using tomographic modeling is used to generate a 2D velocity ‘panel’ or section between the borings. This imaging adds more detail to the geologic layers and feature(s) being investigated. The biggest difference between standard crosshole seismic testing and cross borehole seismic tomography is generally the borehole separation and desire to resolve complex geologic or manmade features.
Limitations
Cross Borehole Seismic Tomography can be costly. Tomography is data-intensive and specialized 3-D analyses software is required for true three-dimensional imaging. Model errors can be present due to limited ray coverage near the image boundaries and noise. The boreholes may need to be prepared specifically for seismic cross-hole surveys in accordance with ASTM D4428. Borehole deviation data needs to be acquired.
Separation and geometry of multiple pairs of borings dictates the fidelity of the velocity model produced. Thus, it is important to follow the ASTM standards for both borehole completion procedures and borehole deviation measurements to generate the best possible 2D panel of P- or S-wave velocity.
Measurements and Relevant Physical Properties
Borehole Seismic Tomography is used to develop 2D panels of P- or S-wave velocity between two boreholes, or 3D models within three or more boreholes. Combining these velocity measurements and unit weight for the inter-borehole materials, low-strain elastic moduli can be calculated such as Bulk and Shear Modulus, Poisson’s Ratio, and Youngs Modulus.
Data Acquisition
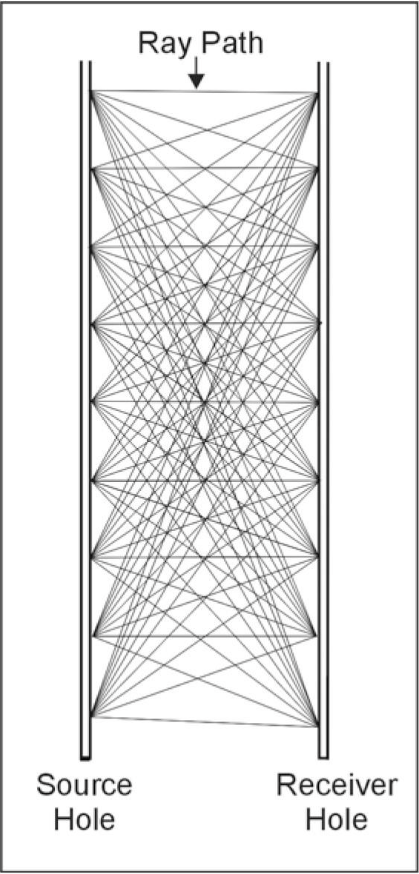
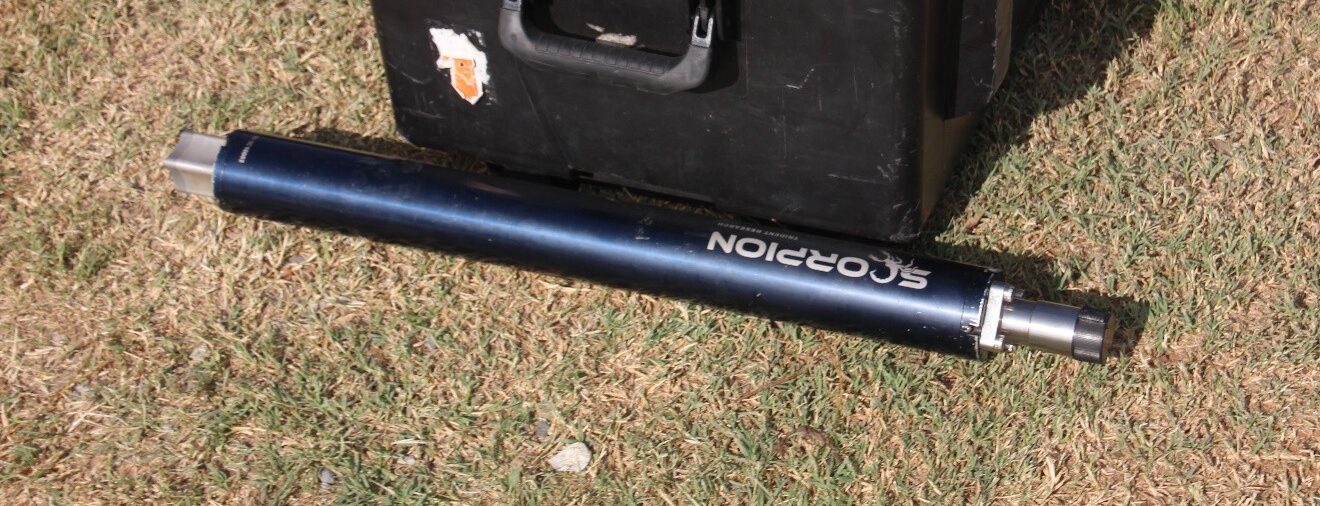
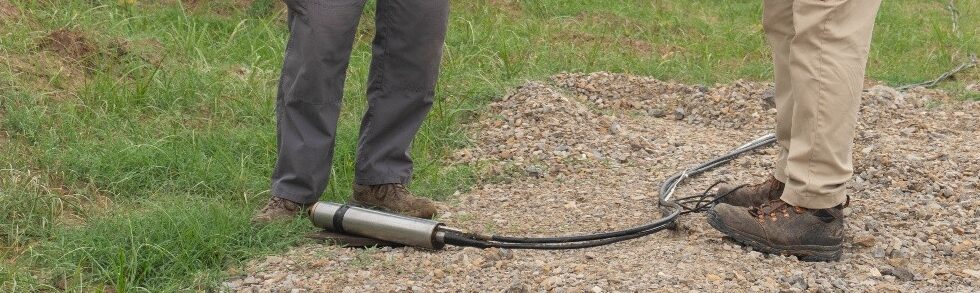
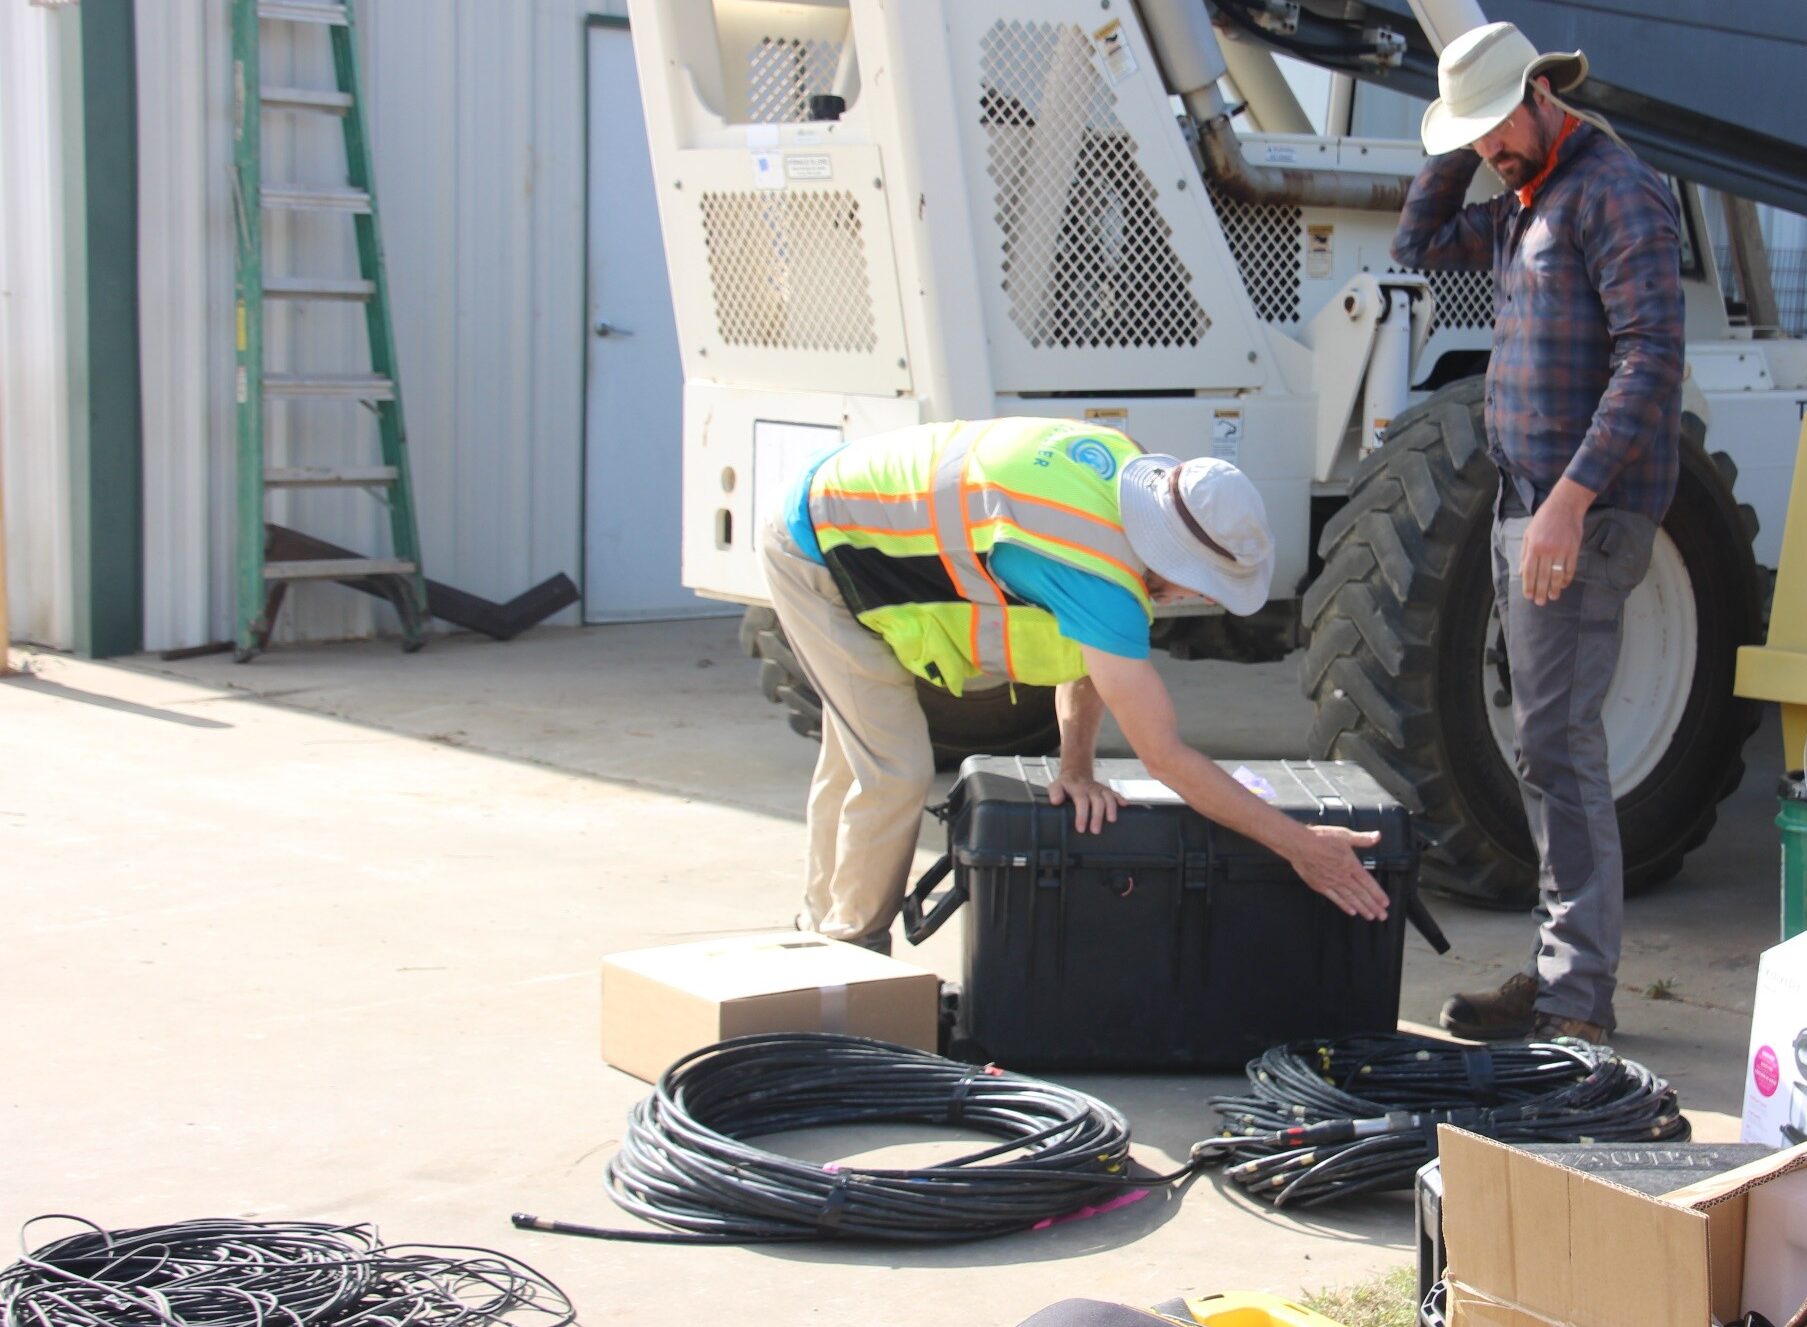
Tomography data collection involves scanning the region of interest with many combinations of source and receiver depth locations, similar to medical CAT scan. Typical field operation consists of holding a string of receivers (geophones or hydrophones) at the bottom of one borehole and moving the source systematically in the opposite borehole from bottom to top. The receiver string is then moved to the next depth location, and the test procedure is repeated until all possible source-receiver combinations are incorporated.
Data Processing
In the tomographic inversion technique, the acoustic wavefield is initially propagated through a presumed theoretical model, and a set of travel times are obtained by ray-tracing (forward modeling). The travel time equations are then inverted iteratively in order to reduce the root mean square (RMS) error between the observed and computed travel times. The inversion results can be used for imaging the velocity (travel time tomography) and attenuation (amplitude tomography) distribution between boreholes.
Data Interpretation
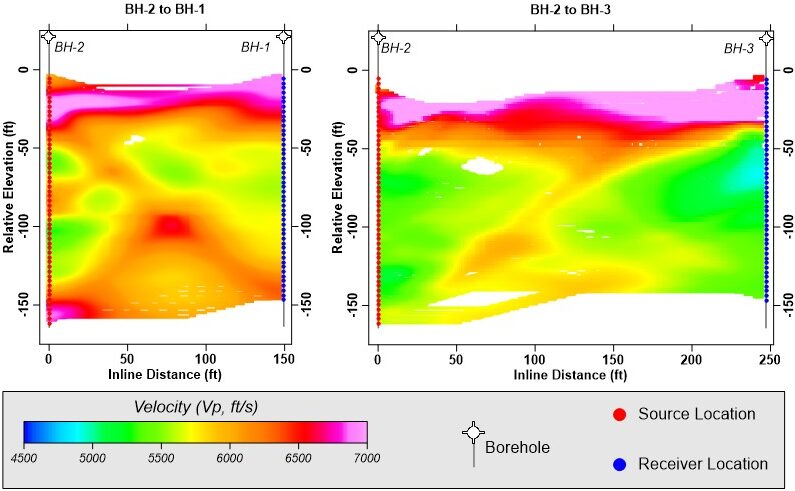
An example of a cross-borehole tomography survey is shown below. The high-velocity zone close to the surface is caused by more competent sediments (shown in hot colors), and less competent and softer materials are shown in cool colors at depth.
Applications
Integrity Testing of Existing Foundations

Mapping Voids, Sinkholes, Abandoned Mines and Other Cavities