
Basic Concept
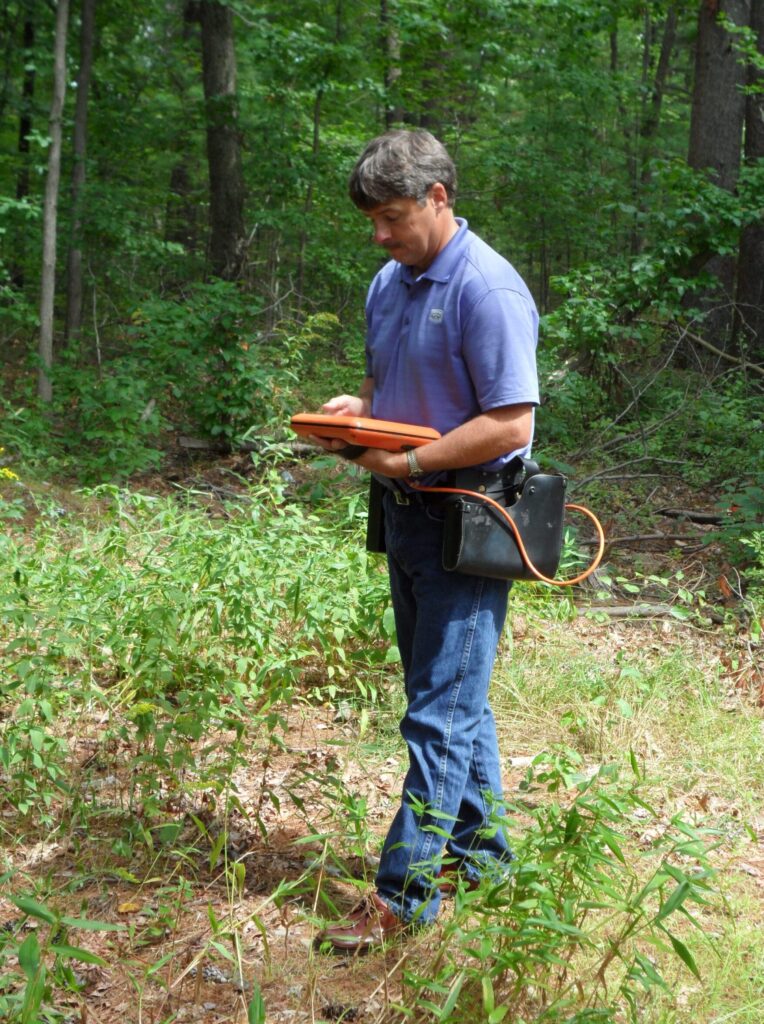
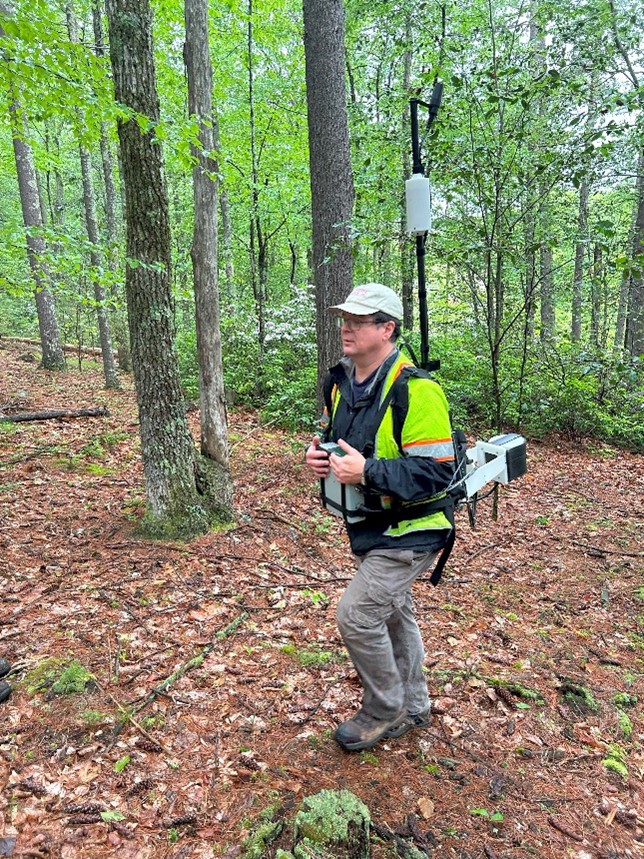
Typical VLF systems. Photo on the left is a single channel VLF system while the system on the right is a 3-channel system with integrated total field magnetics and GPS.
Basic Concept
VLF involves exploration of the subsurface using a transmitter that emits an electrical and magnetic field. At distances greater than a few tens of miles from a VLF transmitter, the radio wave propagating as concentric circles about the transmitter behaves as a plane wave with a vertical electric field and a horizontal magnetic field. The magnetic fields cause electric currents to flow in subsurface conductors. Such induced currents, in turn, produce secondary magnetic fields which can be measured and interpreted in terms of the spatial variation of electrical conductivity. The strength of the incident magnetic field in the earth decreases with depth, and, therefore, the induced currents decrease with depth. Thus, the method is sensitive to conductivity changes to depths of about 100 to several hundred feet, with the exact value depending on the frequency of the signal and the electrical conductivity of the subsurface.
VLF is a good geophysical method to explore for bedrock fracture zones for the following two reasons. First, the dip of many fracture zones is within 10°- 40° of vertical, so the vertical orientation of the electric field is highly sensitive to most fracture zones. Second, fracture zones are electrically conductive. The electrical conductivity of bedrock depends on the porosity and electrical conductivity of the fluid filling the pores. In bedrock, the rock outside fracture zones is highly resistive, providing a clear contrast from the fraction zones.
Limitations
VLF surveys should be conducted in areas with relatively shallow bedrock (less than about 50 feet), in areas where bedrock fractures are vertical or near vertical. In addition, the area should have relatively thin conductive overburden with a resistive host rock. VLF data is subject to interference from buildings, fencing, underground pipelines, and other subsurface conductors, and from underground and overhead power lines. Thus, for some settings, the use of this method might be difficult, if not inappropriate.
The best orientation of the survey lines must be considered when performing VLF surveys. The lines should be roughly perpendicular to the expected fracture zone orientations, as well as perpendicular to the direction of the source transmitter from the site. In an optimal setting, the transmitting station should be parallel with the long axis of the fracture zone and the survey line perpendicular to both. In practice, one can usually meet these “requirements” within ~ +/-30°.
Measurements and Relevant Physical Properties
The VLF-EM method uses electromagnetic signals that are generated by high-powered submarine radiocommunication transmitters. When a transmitted signal travels through the earth and interacts with a conductive body like a fracture, the combined fields of the transmitter and fracture create measurable signals at the surface. These signals are proportional to the in-phase (i.e. real) and out-of-phase (i.e. quadrature or imaginary) components of the secondary field and relate to the conductivity and water content of the fractures.
Data Acquisition
VLF data are acquired at fixed intervals along roughly parallel transects in two orthogonal directions that cross the area of interest. Newer VLF systems allow for the acquisition of data from up to three separate VLF transmitters at once, greatly improving the productivity of surveys. VLF transmitters are scattered around the world and are selected for use based on their locations as only fractures that are oriented parallel to the signal direction are detectable. Traditionally, on-ground surveys are carried out with stop and go measurements. For large scale surveys such as bedrock or ore mapping, manned airborne surveys have shown great success. In recent years, UAV (drone) VLF-EM has also been carried out as a cost-efficient alternative to manned airborne surveys.
Data Processing
Processing VLF data usually includes applying geometry to the data from either GPS or a local survey grid established in the field and applying a filter to the data to accentuate anomalies caused by bedrock fractures, as described below in data interpretation.
Data Interpretation
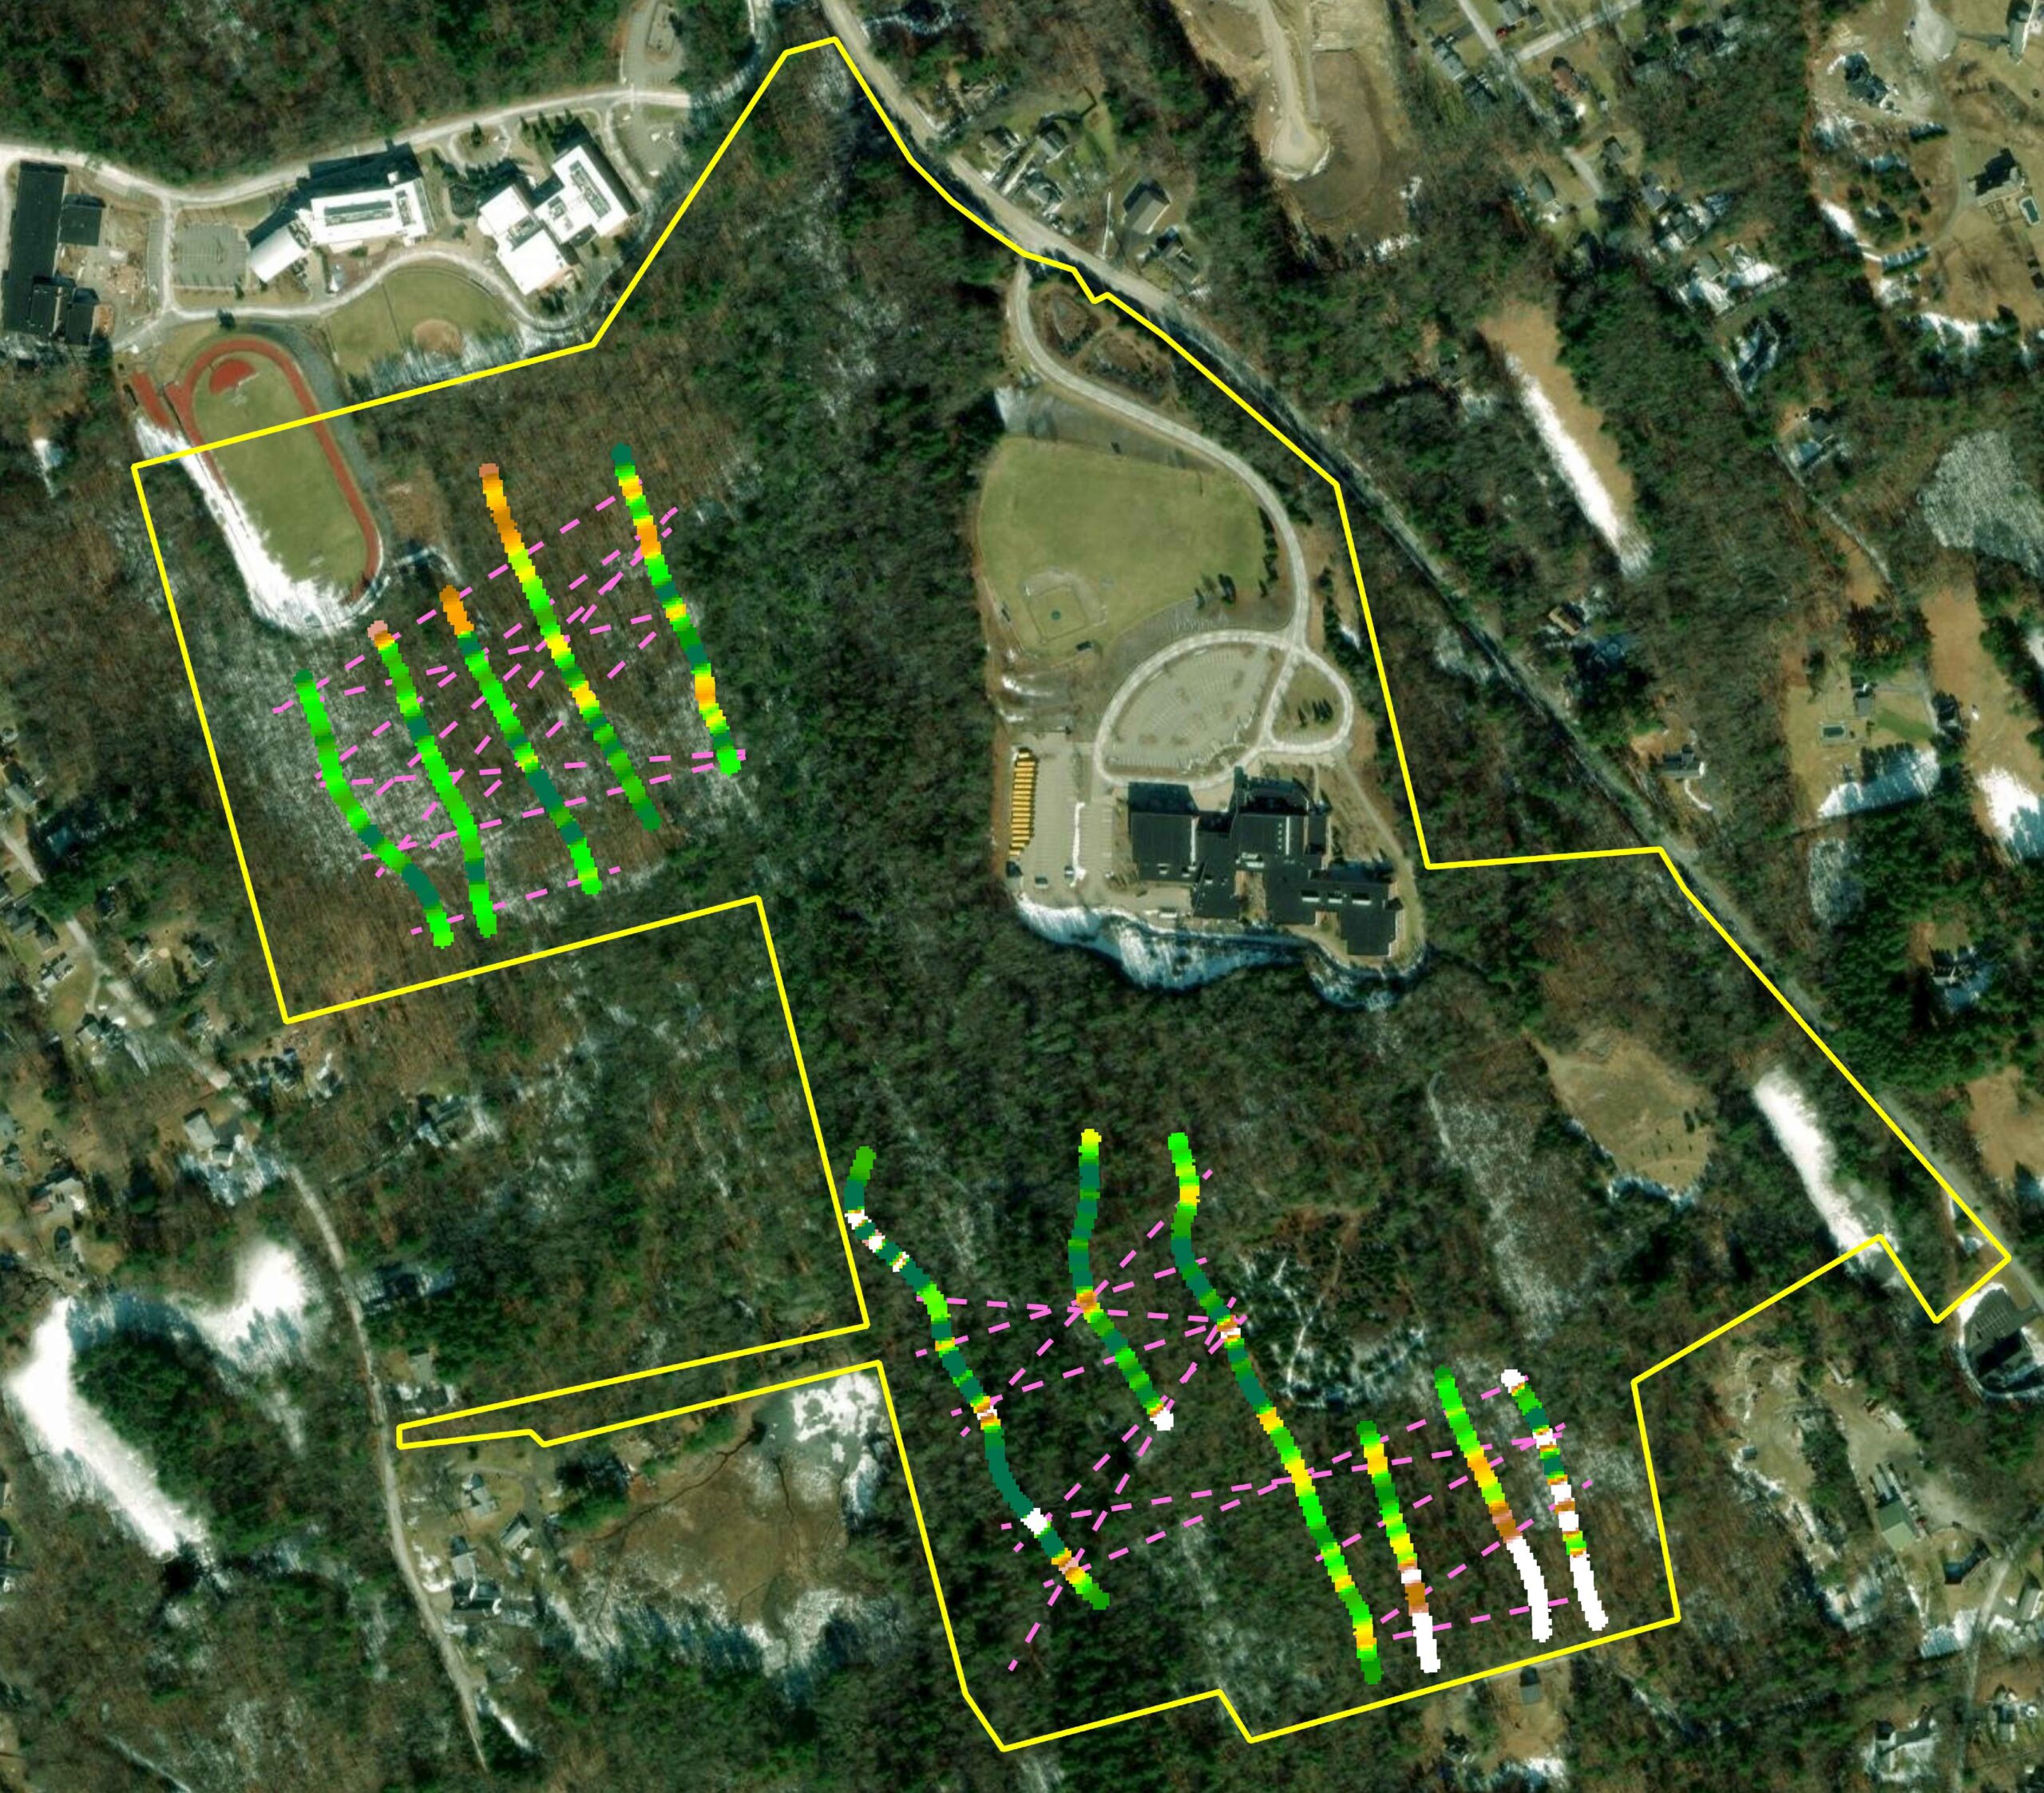
The real and imaginary components of the VLF field are used for the detection of water-bearing and mineralized bedrock fractures, respectively. The acquired data is typically filtered and is plotted in either track or profile format. The filter applies a phase shift to the VLF anomalies to place the peak of the anomaly peak over the location of the conductive object. Thus, the positions of water bearing fractures are recognized in filtered VLF data by positive peaks in the filtered real (in-phase or tilt angle) component data. Below is an example track plot of the VLF data acquired over several roughly parallel lines in two areas of the site. Bright colors in the example track plots indicate the presence of possible water bearing fractures. The ‘highs’ are then correlated between VLF survey lines and connected to form zones of increased conductivity (the dashed lines shown below). Because fracture zones of increased hydraulic permeability or mineralized fracture zones in bedrock are likely to have increased electrical conductivity; such anomalies are excellent guides to such features.
Applications

Bedrock Characterization

Mapping Groundwater Surface and Flow