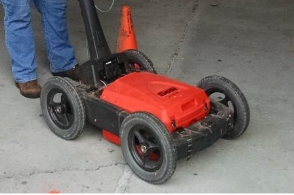
Ground Penetrating Radar (GPR) detects, and maps features of contrasting electrical properties, and many utilities have electrical properties very different from the surrounding soil. In good soil conditions, the method can typically be used to rapidly provide the accurate horizontal and estimated vertical position of utilities in the field with little to no data processing.
Data Acquisition
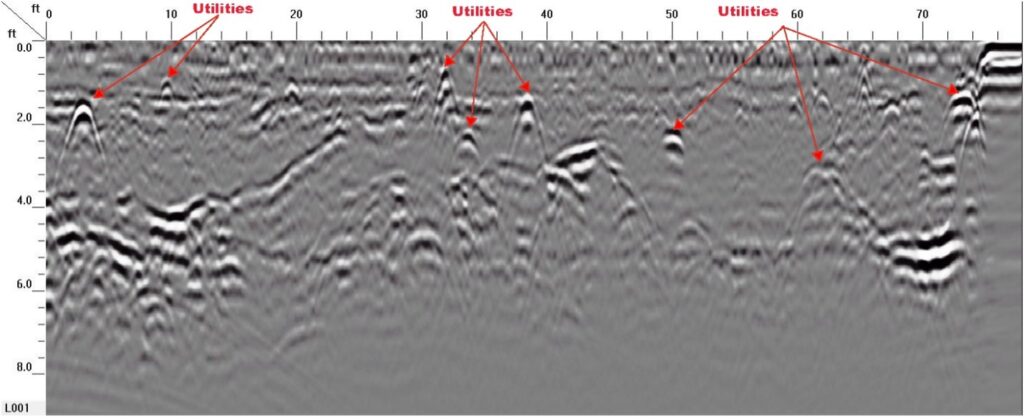
GPR surveys are conducted by pulling/pushing the antenna across the ground surface at a normal walking pace. The data can be acquired in a grid pattern, if later processing is required for 2D/3D presentation, or can be acquired along erratic transects if only field marking is required. Modern systems record and store data for later processing, as well as display the data in real time. A typical GPR record is shown in the figure below and illustrates anomalies attributed to several utilities. The strength of the reflection is controlled by the contrast in the dielectric properties of the utility and the surrounding soil. Metallic utilities produce stronger GPR reflections than PVC utilities.
Data Processing
The can processed similar to reflection seismic data. Routines such as distance normalization, gain, horizontal and vertical scaling, along with frequency filtering, can be performed. However, depending on the data quality, this may not be necessary since the field records may be all that is needed to observe the utility.
Data Interpretation
Utilities produce parabolic reflections as seen above in the example GPR record. It is important to note that other features such as boulders, drums, and other similar objects also produce similar reflections. However, reflections for utilities will be present over numerous parallel GPR traverses where GPR reflections from other point type features will on be present on one or two records, allowing for identification.
To calculate the depth to the utility, the speed of the GPR signal in the soil at the site needs to be determined. This can be estimated from handbook speeds for typical soil types, or, more optimally, it can be obtained in the field by conducting a small traverse across a buried feature whose depth is known.
Deliverables
Results of GPR surveys for utilities and other man-made structures are typically provided as 2D georeferenced plan views showing the interpreted horizontal (and vertical, if determined) positions of the detected features to show the spatial distribution of such features superimposed on civil plans of the site.
Advantages
The GPR method provides a rapid technique for locating utilities making it a very cost effective method. Since the data can be viewed on a screen on the instrument, the locations of anomalies can be marked on the ground at the time of the survey. For larger surveys, the data are typically processed and interpreted in the office and plans are generated showing the 2D or 3D locations of detected utilities.
Limitations
The most limiting factor for GPR is that its success is very site specific and depends on having a contrast in the dielectric properties of the target compared to the host overburden, along with sufficient depth penetration to reach the target. However, it is likely that most utilities will provide the desired dielectric contrast needed, thus depth of penetration is probably the most important factor. Penetration depends on the frequency of the antenna, the conductivity of the overburden, and whether clay is present in the overburden. In addition, for lower frequencies, where the antenna is not shielded, reflections can occur from other objects. Generally, this should not be a problem for utility searches since most of the higher frequency antennas are shielded and are the ones used for buried utility surveys. Wherever possible, GPR surveys for utilities should always be combined with one or two additional geophysical methods such as time domain electromagnetics of frequency domain electromagnetic pipe and cable locating allowing for a more thorough search and allowing for more types of utilities to be detected.