
Basic Concept
Horizontal-to-Vertical-Spectral Ratio (HVSR) is a passive seismic method used to determine the resonant frequency of the ground. It has been used primarily to map thickness of a surface layer (e.g. unconsolidated sediments or glacial till) which overlies a high-velocity layer (e.g. bedrock or a similar high-seismic-impedance interface), assuming that either the shear wave velocity or thickness of the surface layer is known at a reference point.
The greatest advantage of the HVSR method is that it can provide significant information with minimal effort in the field as well as in processing. Small instruments, such as the Tromino, can be deployed very quickly with preliminary results available within a few minutes after acquisition of the data. A single operator can acquire data with multiple instruments simultaneously to enhance productivity. HVSR data can be useful for validating data collected with other methods, e.g. Seismic Refraction Tomography (SRT), Multichannel Analysis of Surface Waves (MASW), or Electrical Resistivity Tomography (ERT), and can assist in resolving processing uncertainties with those data sets. Another significant advantage is that it is very effective at sites where there is an abundance of cultural noise, e.g. along a busy highway or in a city. HVSR can provide results where active source methods (e.g. SRT or MASW) will fail.
Limitations
At remote sites where there is a lack of passive seismic background noise, there may be inadequate signal to yield valid HVSR spectra. Alternatively, at such sites, it may be necessary to acquire data for a longer period of time than the typical 10-30 minutes. There are also sites where only poor quality spectra can be acquired, either because there is too little impedance contrast in the subsurface, poor noise conditions, or other unknown factors. Therefore, a test phase is always recommended before committing to a larger HVSR effort.
Measurements and Relevant Physical Properties
HVSR is used to develop maps or profiles that represent the thickness of a low-velocity surficial layer that overlies a higher-velocity layer, e.g. bedrock. In order to produce such maps or profiles, either the velocity of the surficial layer or the depth to bedrock must be known or estimated at a reference site, such as a borehole or a value determined from an ancillary geophysical data set. Secondary HVSR peaks can be incorporated into the cross sections, although these should not be assumed to represent secondary interfaces, as they might be associated with other types of seismic energy, so such cross sections must be interpreted with caution.
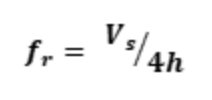
HVSR requires broadband 3-component ambient seismic noise data at a fixed location, commonly recorded for a duration of 10-30 minutes. The frequency spectra from these data are computed in shorter intervals, perhaps 20 seconds, and these spectra are stacked and used to compute an average spectral ratio of the horizontal-component magnitude spectrum divided by the vertical-component magnitude spectrum. Where sufficient noise is available and a velocity contrast occurs between a near-surface layer and a deeper, faster layer, a quarter wavelength resonance will yield a dominant peak in the spectral ratio, which can be expressed as:
(1)
where fr is the resonant frequency in Hertz, which may be picked from the H/V spectrum, Vs is the seismic shear velocity of the surface layer, and h is the thickness of the surface layer. The underlying theory upon which this equation was developed is based on shear (body) waves as the energy source, although, surprisingly, it has been shown that the solution is valid for surface wave energy as well.
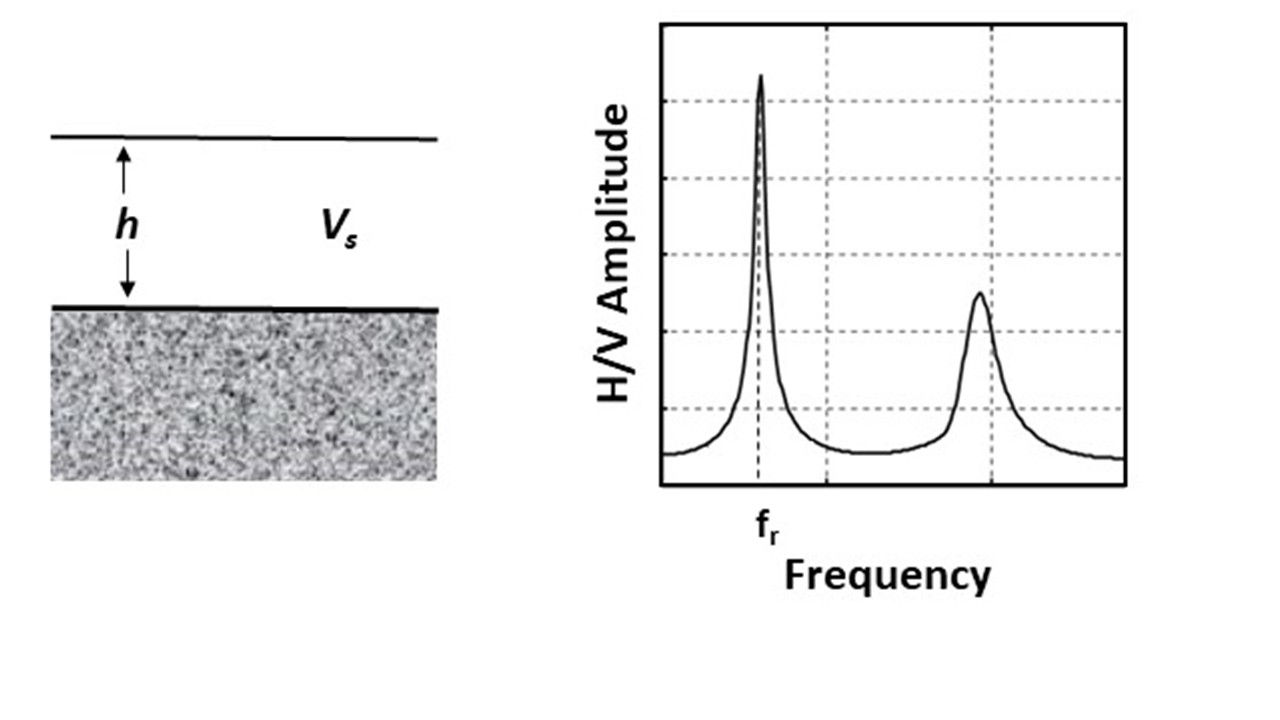
Recent studies have shown that important information may be extracted by assessing the variations in the amplitude and frequency of secondary HVSR peaks that are commonly seen in HVSR spectra as well as the amplitude and frequency of the primary peak. In some cases, the spectra can change over distances of a few meters, and these changes might indicate lateral structural changes in the subsurface. HVSR data can also indicate velocity inversion (low velocity zones), and can aid in the interpretation of other geophysical data sets.
Data Acquisition
HVSR data acquisition is very simple. At a selected location, surface vegetation is cleared by hand or with a trowel to expose a flat, mostly unvegetated soil surface. The instrument is oriented with north before being pushed gently and continuously into the soil, paying attention to the level indicator. There should be no twisting or turning or other actions that would result in poorer instrument coupling. Coupling is more important than perfect leveling or alignment with north.
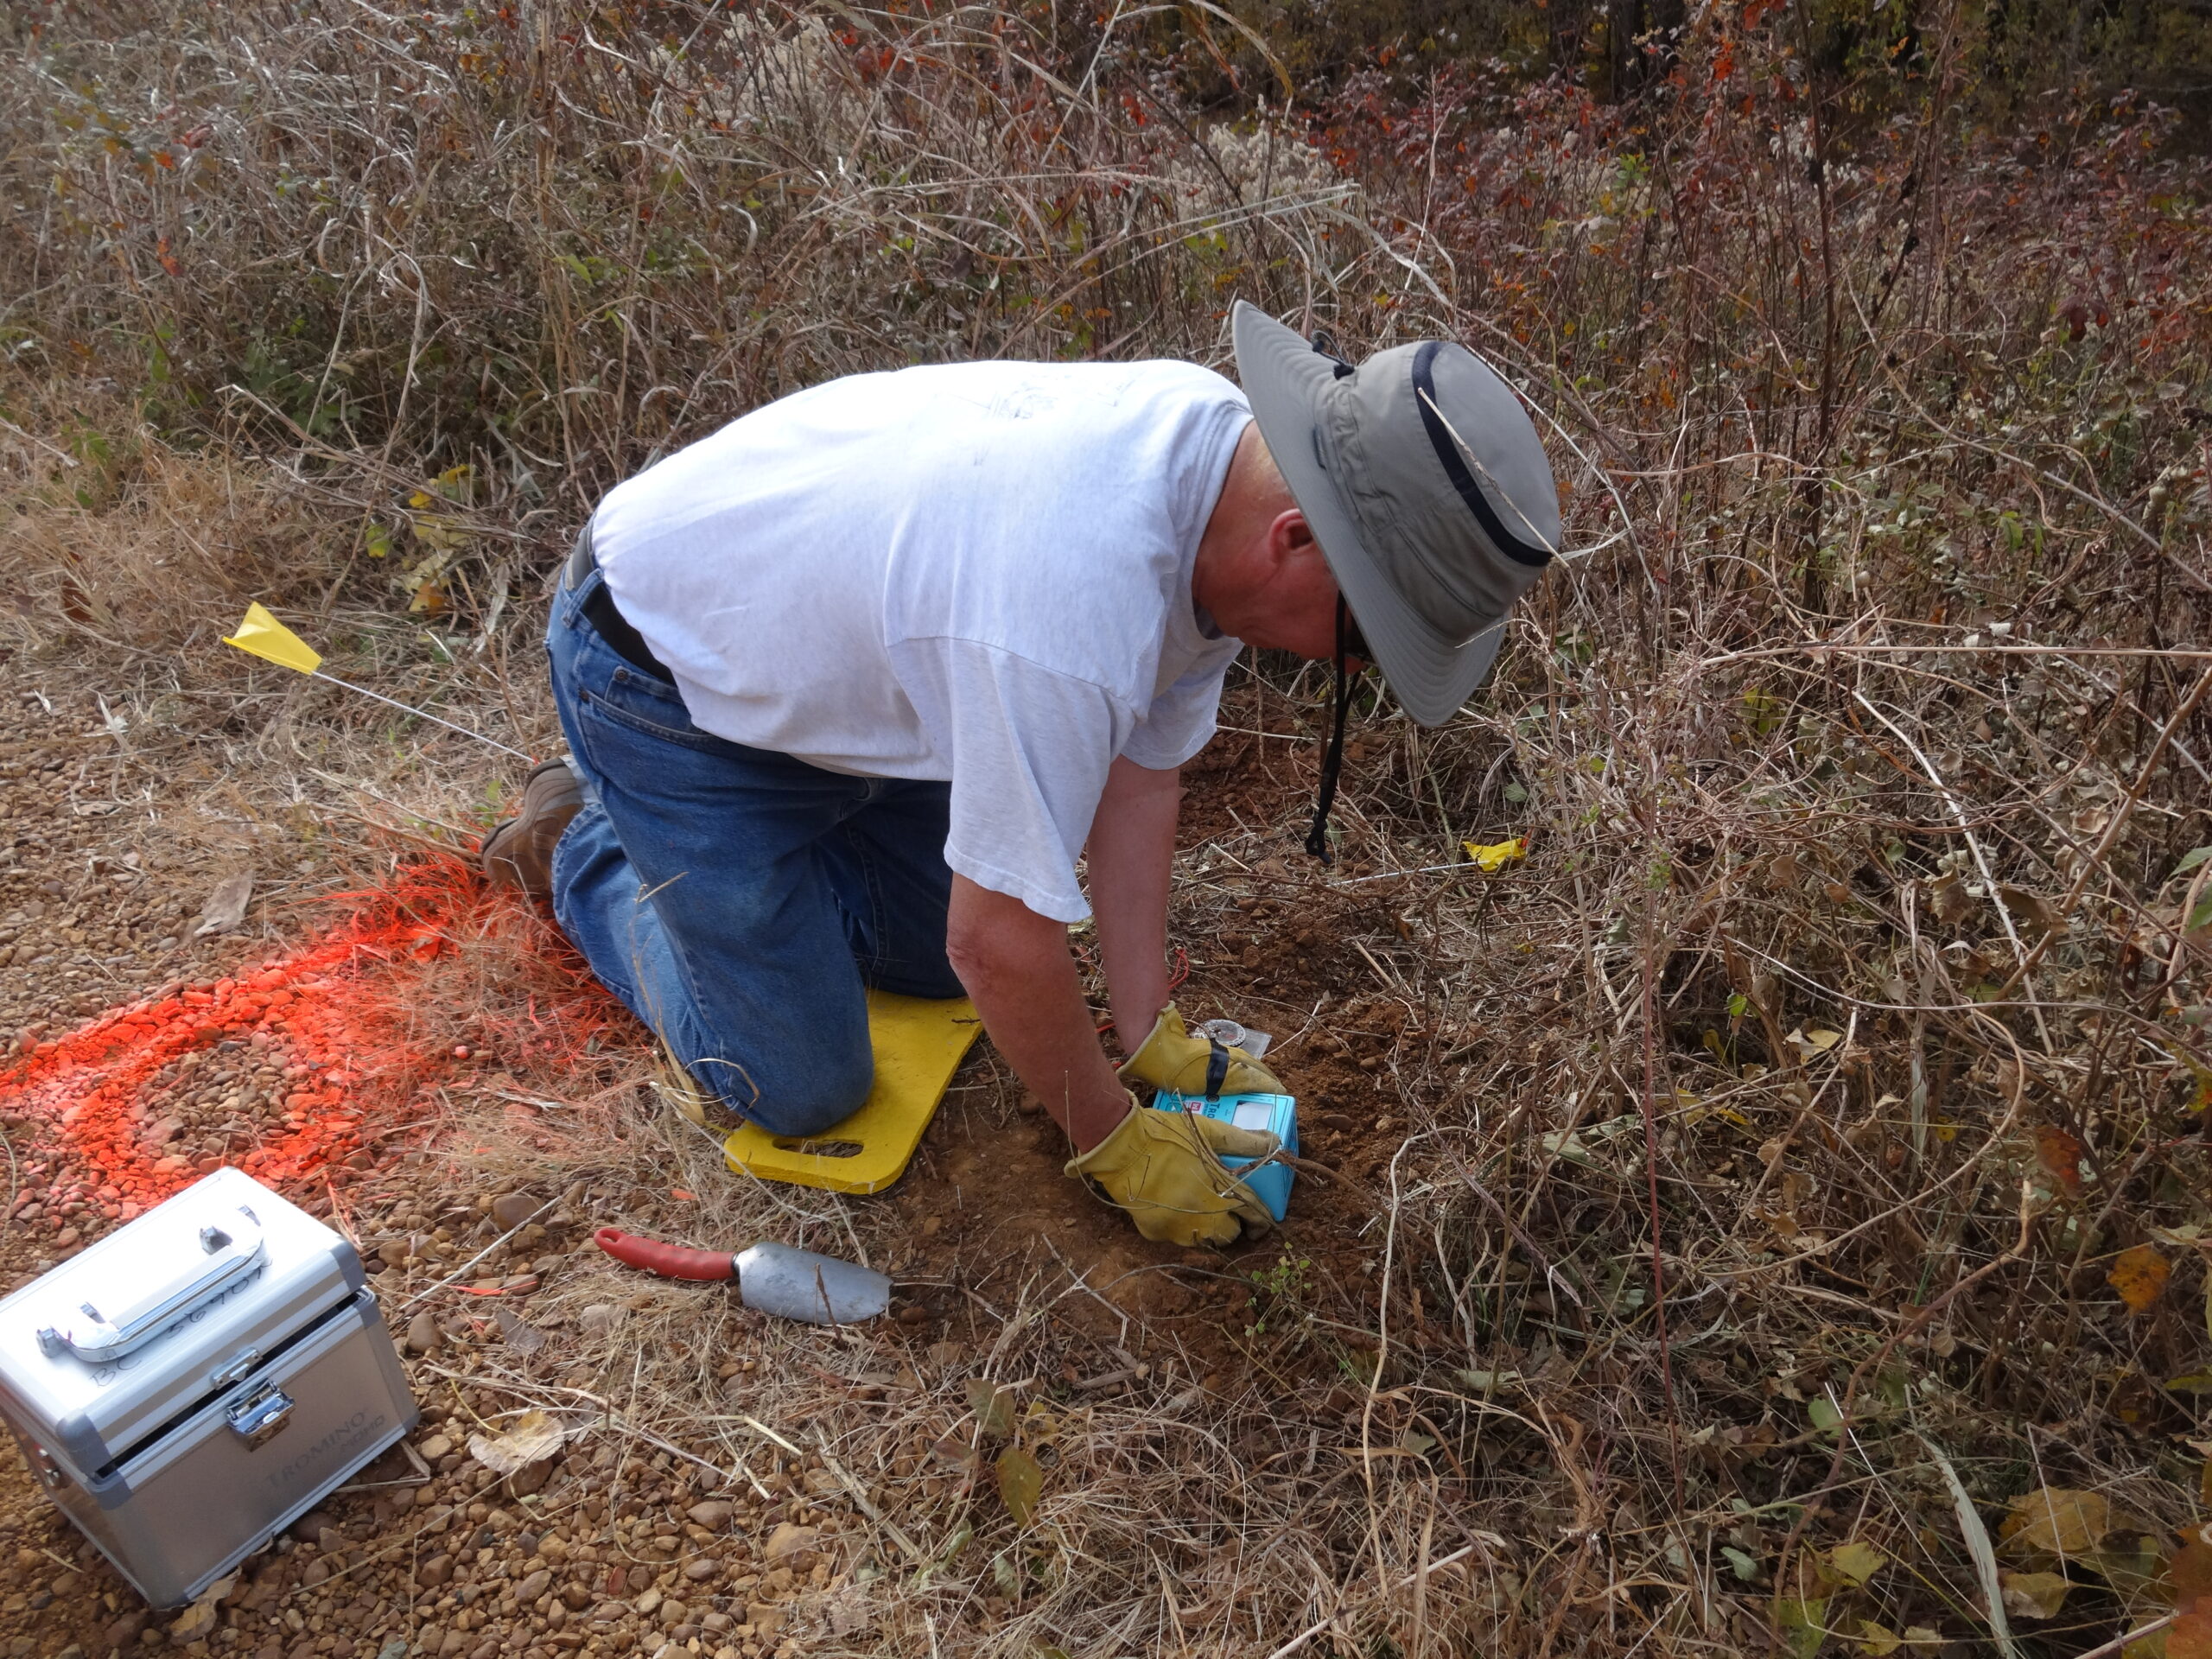
The instrument is then initiated to begin recording for a selected period of time, and the operator avoids movement in close proximity to the instrument during the recording window. Other instruments can be deployed while the first is recording data. After the recording cycle is complete, the instrument can be moved to a different location, and the process is repeated. Field notes, and in some instruments an internal GPS, can be used to associate a particular location with a data partition on the instrument.
Measurement spacing is somewhat arbitrary; in many larger scale bedrock mapping efforts, stations may be separated by several hundred meters.
Data Processing
At the completion of the survey, data are downloaded by linking to a laptop, and are stored in a file in the computer. The manufacturer’s software tool is typically used to perform base level processing, which consists of stacking the short, e.g. 20-second spectra for each channel and computing a horizontal-to vertical spectral ratio for each measurement location. The software also calculates a peak frequency with plots of the full spectra, error bars, and the individual channel spectra. Data are inspected to eliminate anthropic noise sources, which might be associated with machine vibrations or similar. Data can be acquired with other instruments with a similar processing scheme. Pseudo-depth cross sections may also be produced which display features of secondary peaks in addition to the primary peaks.
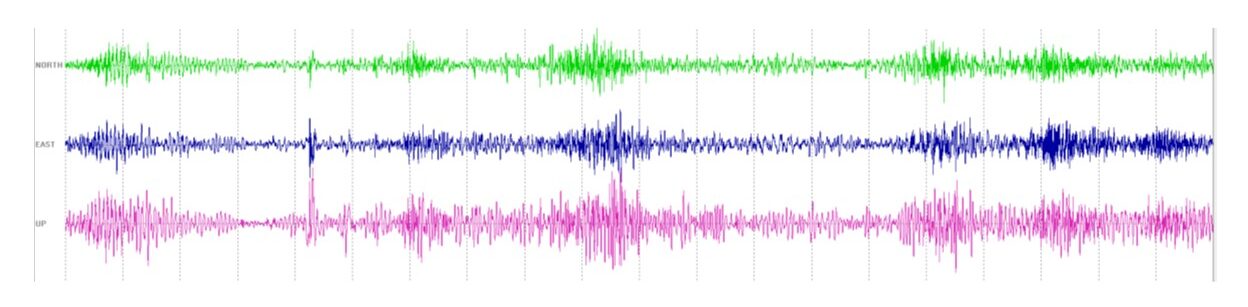
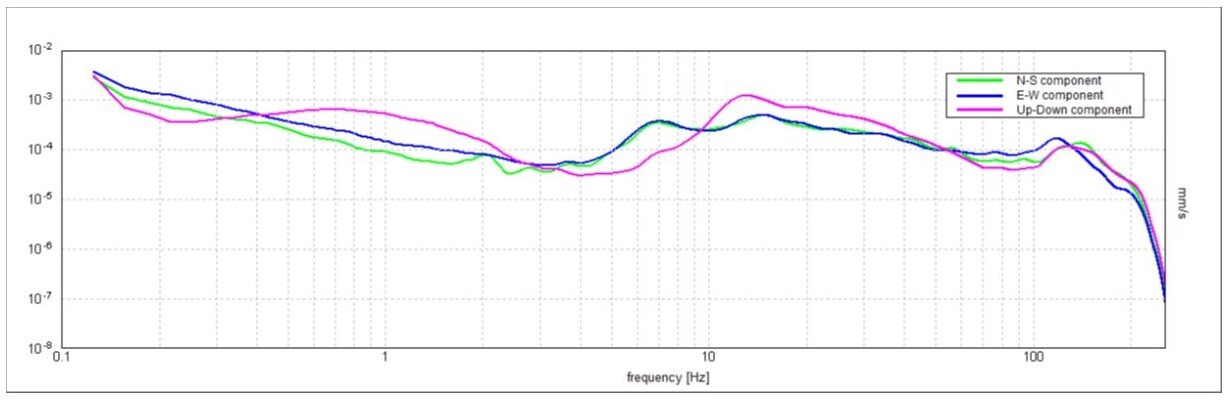
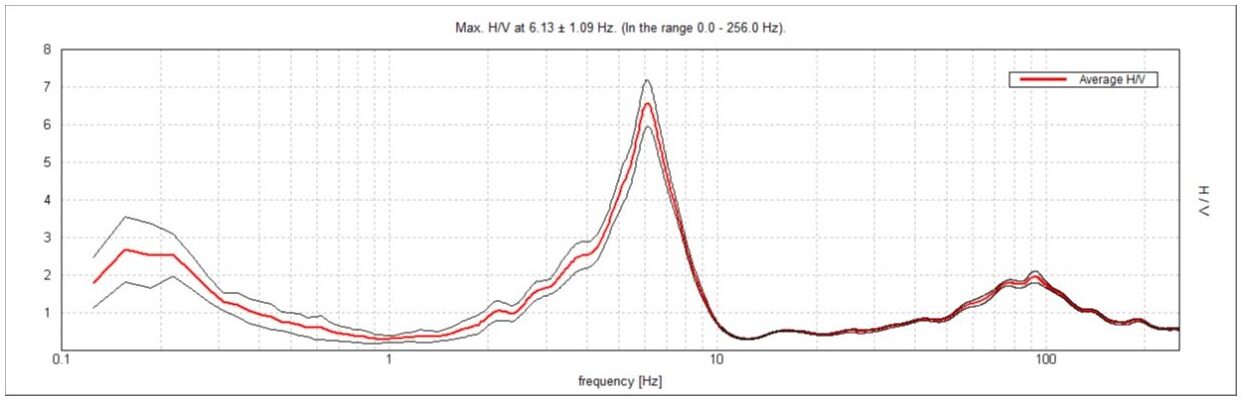
HVSR data processing steps (from Doll et al., JEEG paper in press)
Data Interpretation
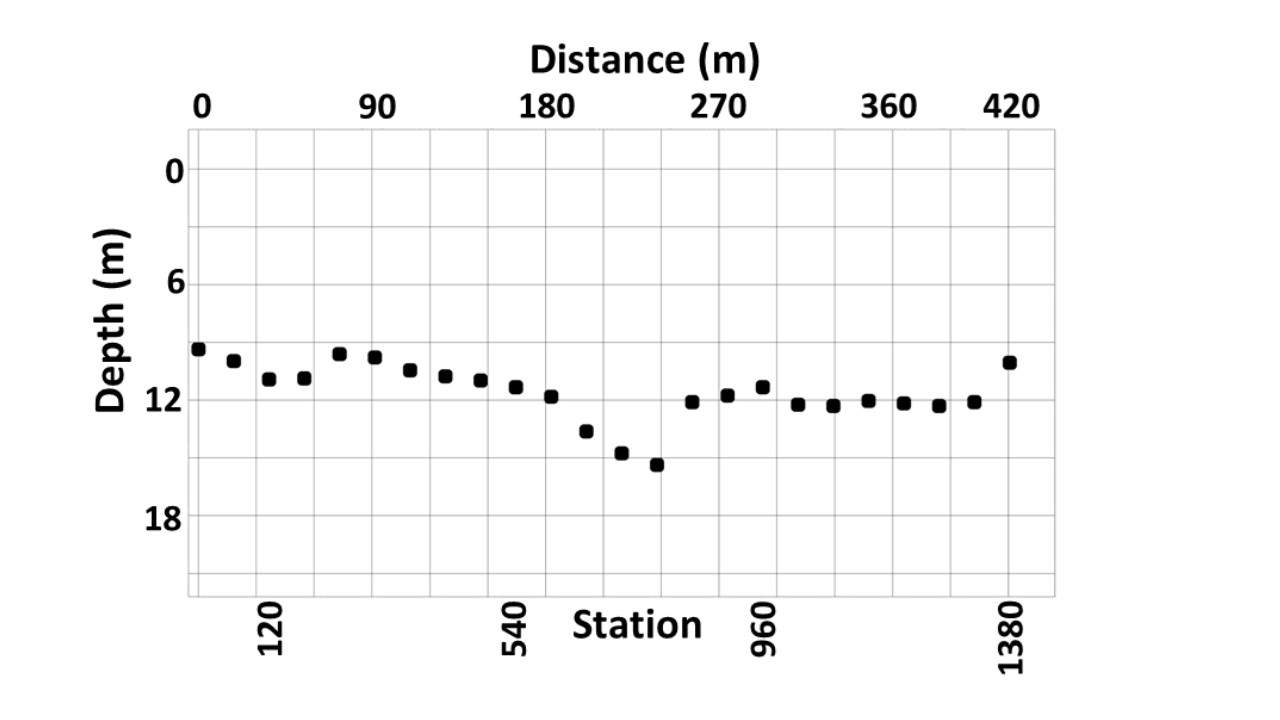
By plotting the depth to bedrock associated with HVSR peaks along a profile, one can produce a cross section of bedrock depth for that profile. The interpretation of the depth profiles is straightforward.
A less-frequently seen application of HVSR is to produce a pseudo-depth cross section, which associates each amplitude from all of the HVSR spectra with corresponding depths, and plots the HVSR amplitude as a function of pseudo-depth . This can be used to understand spatial relationships of secondary peaks in the spectra. It is especially helpful when attempting to locate lateral changes in the geology (e.g. a fault or void), which can be associated with significant lateral changes in the HVSR spectra.
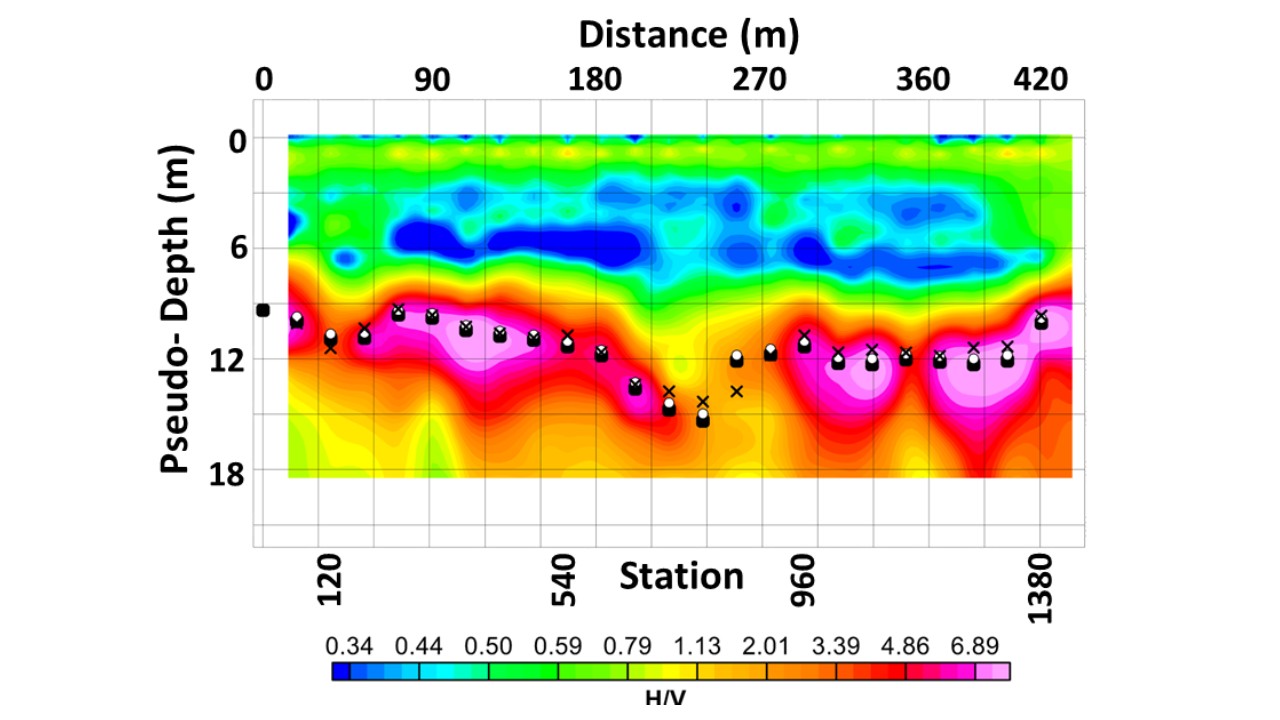
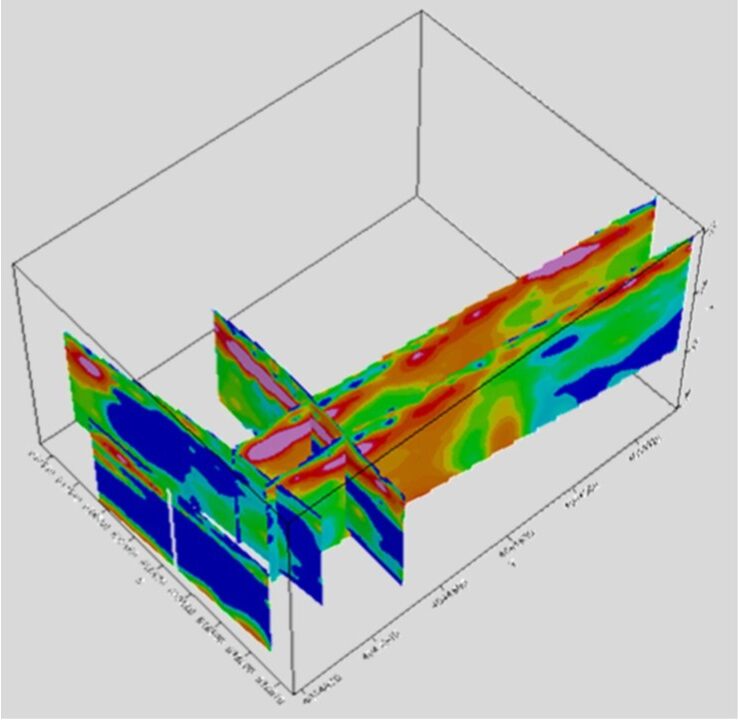
These pseudo-depth plots, when derived from closely-spaced data, can also be used to locate lateral subsurface transitions in three dimensions.
Applications

Mapping Voids, Sinkholes, Abandoned Mines and Other Cavities
Working Platform/Load Transfer Platform (Soil Improvement) Evaluation