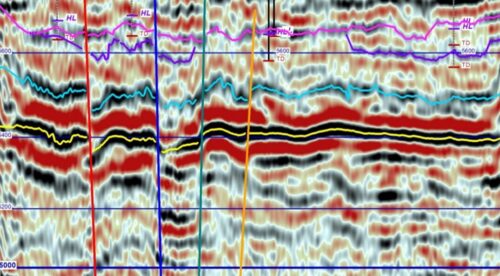
The seismic reflection method uses elastic waves to investigate the subsurface. Sound waves generated by any of several shear wave or compressional wave sources travel downwards in the subsurface, are reflected at interfaces where either density or the velocity of the waves change, and the elapsed time between the initiation of the waves and their arrival at the geophones is recorded. Several different pairs of source and geophone locations are used for each reflection point on an interface, and the signals for the several pairs are summed to improve the signal-to-noise ratio.
Seismic reflection can be used for characterizing soil and rock, mapping bedrock topography, detecting fractures and faults, and identifying lithological changes by analyzing how seismic waves reflect off different geological layers and structural features. Seismic reflection provides high-resolution data compared to other geophysical methods, making it a valuable tool for mapping the top of bedrock and identifying fractures, faults, and lithological variations. The method is best suited for investigation depths greater than 10 to 20 m, depending on the geology. For shallow rock, seismic refraction is preferred.
Data Acquisition
For shallow investigations, sledgehammers may be used as a seismic source. For deeper investigations, more powerful sources such as weight drops or explosives should be used. A line of geophones is placed on the ground surface. The seismic source is then engaged at regular intervals along the geophone spread and the resulting reflections are recorded by the geophones and stored in a seismic recorder. Seismic reflection surveys require that the geophone and shot spacing are appropriate for the particular problem. The number of channels should be chosen so that the spread length is appropriate for the desired depth of investigation, and the geophone spacing needs to be such that the rugosity of the reflecting surface is imaged properly.
Data Processing
Data processing is the same as for any other seismic reflection survey. Seismic reflection data is initially recorded in two-way travel time, i.e. the time it takes for a wave to travel to a reflector and return. To be useful for engineering, these times must be converted to actual depths using velocity models derived from velocity analysis or calibration with boreholes. If digital geophysical sonic and density borehole logs are available, a synthetic seismograph may be generated to compare with and significantly improve the depth calibration of the imaged seismic data.
Data Interpretation
Seismic reflection data is sorted into sets of seismograms for each reflecting point, filtered, if needed, to remove noise. Subsequent processing includes muting or zeroing unwanted arrivals such as reflections, air waves, and ground roll, correcting for the different travel path length of each source-geophone pair for each reflecting point, adjusting for differences in the surface materials within a few feet of each geophone and each shot point, and plotting profiles of the processed seismograms for subsequent interpretation. The final stacked profiles are interpreted by connecting linear reflections on adjacent seismic traces. To relate reflections recognized in seismic profiles to the geologic structures described in boring logs, travel times for the seismic reflectors must be converted to depths. Because the velocities of unsaturated soils, saturated soils, and bedrock differ greatly, the depth scales for the stacked profiles are not necessarily linear and may vary with depth.
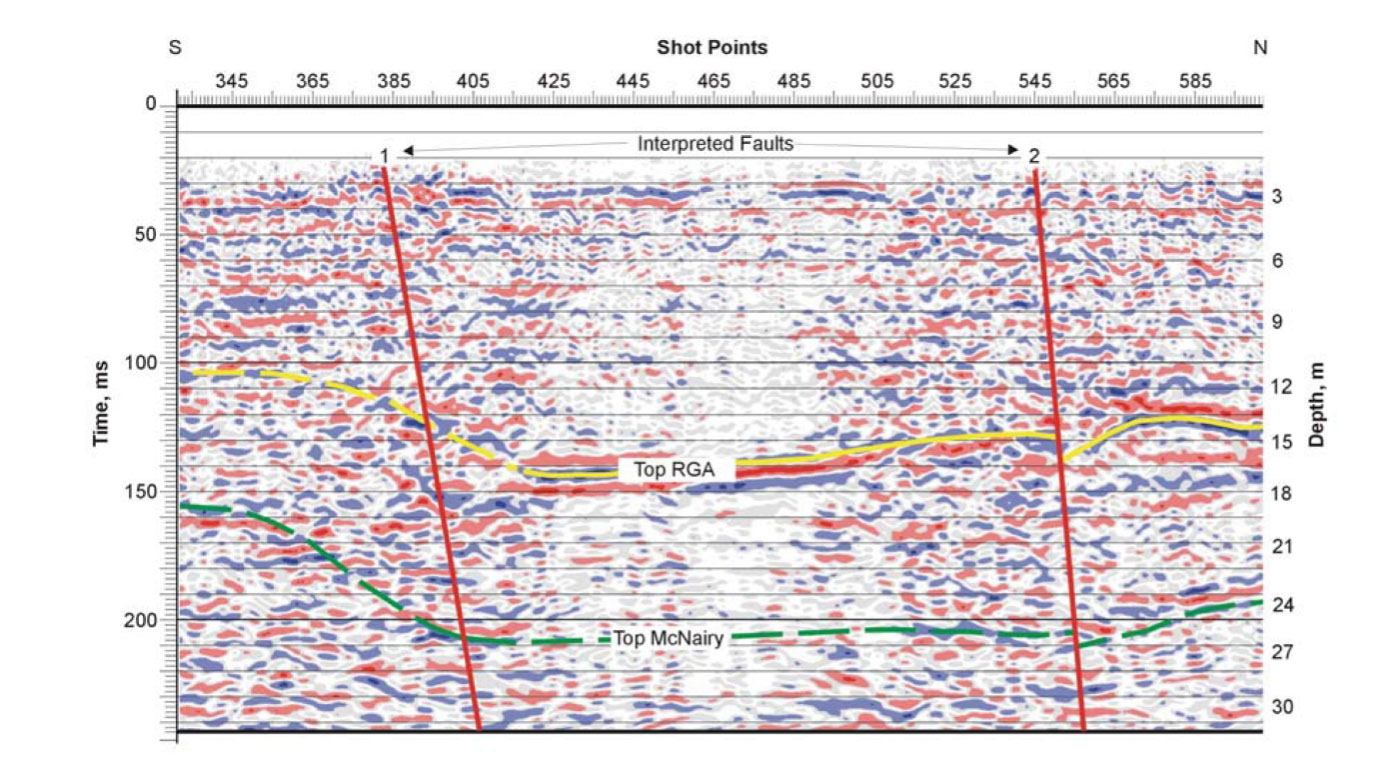
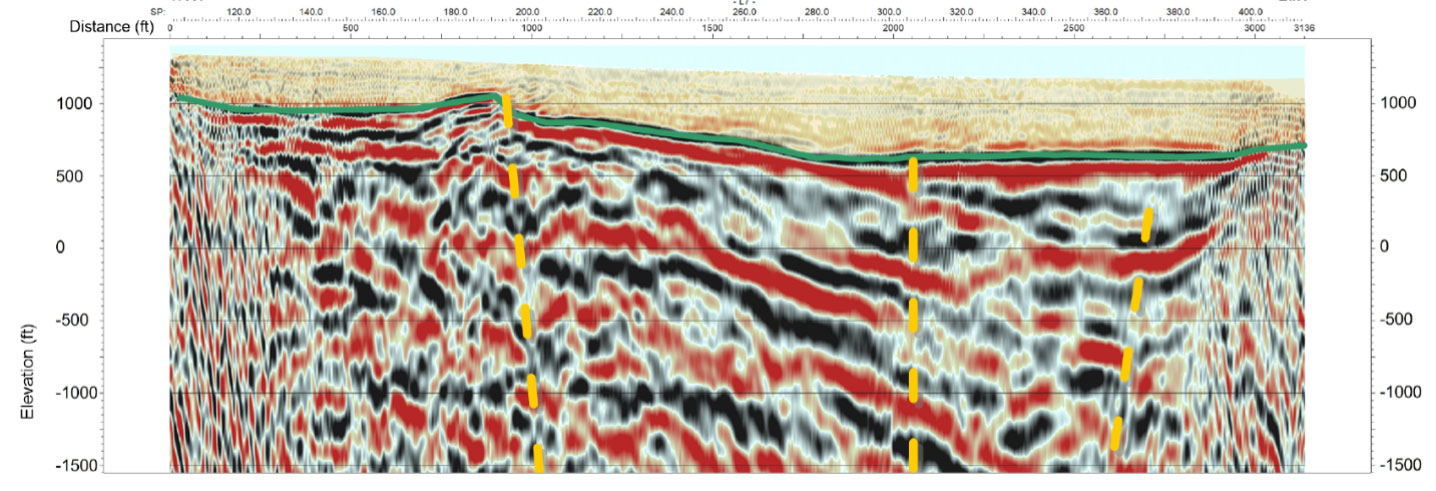
The figures below present typical seismic reflection sections showing several inferred interfaces and interpreted faults. As can be seen, the character of the reflectors changes across the section. Most notable is the offset in the lateral nature of the interfaces inferred at the locations of the faults. Some of the reflectors are more pronounced and some are less pronounced between the inferred faults.
Deliverables
A report from a seismic reflection survey should primarily focus on discussing the findings on the survey, and interpretation of the various seismic sections. Borehole data (if available) should be used to correlate the seismic sections with lithology. Descriptions of equipment and software used, test setup, procedures, data acquisition details, and data processing schemes should also be discussed.
Advantages
The seismic reflection method provides a pictorial section that resembles the subsurface layers. The method is not restricted, as is the seismic refraction method, to a section in which the layer velocities successively increase. Maximum imaging depth with seismic reflection is larger than with other seismic methods (such as seismic refraction or surface waves).
Limitations
The main attribute of the seismic reflection method is that it provides a visual image of the continuity of the reflectors along the surveyed line. Layer velocities are also interpreted but are probably not as reliable as those found using the seismic refraction method. In addition, the method is best suited for investigation depths greater than 10 to 20 m, depending on the geology.
The seismic reflection method is one of the more expensive methods, and requires more field time, more office time, and a significant amount of knowledge by the interpreter to process the data. Local vibrational noise will reduce the signal-to-noise ratio, possibly making the resulting seismic section less definitive.