
Electrical Resistivity Imaging (ERI) uses direct current to assess the electrical resistivity of subsurface materials, which correlates strongly with clay content in soils. ERI can be used to map the vertical and lateral distribution of conductive layers which strongly correlate with clay-rich material. The relationship between resistivity and clay content is site-specific and requires ground truth from borehole data.
Data Acquisition
ERI surveys are conducted by deploying multiple electrodes in contact with the ground surface along transects or grids. The inter-electrode spacing is matched to the investigation depth, with larger spacing reaching deeper but sacrificing resolution. Since clay is found above bedrock, surveys to detect clay are typically focused on the relatively shallow subsurface using tighter electrode spacings than deep surveys to map bedrock and bedrock structures.
Data Processing
Processing ERI records for the purpose of estimating clay content requires inversion of the measured apparent resistivity data to produce a model of resistivity distribution with depth and distance. The processing involves iteratively adjusting resistivity values to minimize the difference between measured and calculated apparent resistivity values. Processing includes quality control to remove noisy data points, assessment of model fit to measured data, and verification that the final resistivity model produces geologically plausible results. Multiple 2D resistivity sections can be combined to create 3D models of clay distribution across the survey area.
Data Interpretation
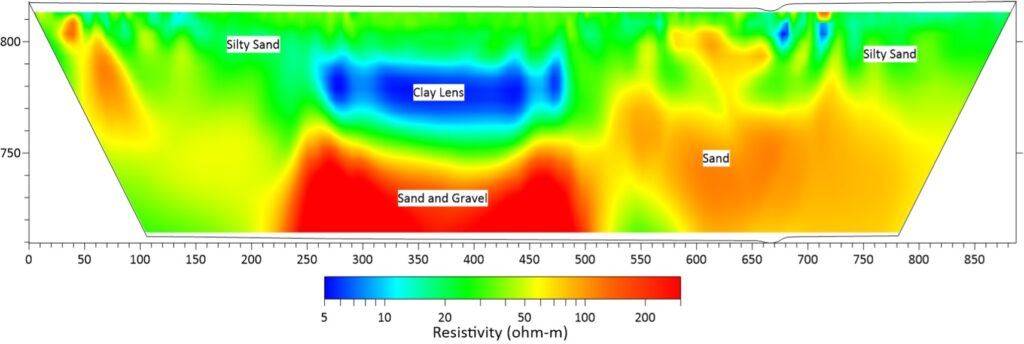
ERI data is interpreted by analyzing the inverted resistivity models and correlating resistivity values with clay content and soil lithology. The data are typically presented as color contour plots showing electrical resistivity as a function of depth (or elevation) and horizontal distance along survey lines. Clay minerals are particularly conductive due to their high surface area and ion exchange capacity. Interpretation is enhanced by integration with prior geological knowledge, borehole data, and laboratory measurements to establish site-specific relationships between measured resistivity and clay percentage. Factors such as groundwater salinity, degree of saturation, porosity, and water content also influence resistivity and must be considered during interpretation. Interpretation can be straightforward when subsurface conditions involve simple layering with strong resistivity contrasts but becomes more complex when multiple factors affect resistivity or when three-dimensional features are imaged with two-dimensional survey lines.
Deliverables
Results of ERI surveys are typically provided as 2D color contour plots showing electrical resistivity as a function of depth and horizontal distance along survey lines, or as 3D resistivity models of the survey area. Resistivity models inform interpreted maps of clay layers showing both vertical and lateral extent, estimated depth to top and bottom of clay-bearing units, and estimated clay content distribution based on resistivity-clay correlations. Cross-sections clearly showing the spatial distribution of clay-rich zones are particularly valuable for geotechnical planning.
Advantages
Electrical resistivity imaging is a noninvasive and economical test method used for subsurface characterization, such as estimating clay content. A large volume of subsurface data can be acquired in a short time frame for relatively low cost compared to drilling. The method is particularly effective for detecting conductive clay layers within more resistive sand or gravel sequences. ERI provides continuous coverage along survey lines, revealing lateral variations in clay content that would be missed by widely-spaced boreholes or individual soundings.
Limitations
The depth of investigation depends on the electrode spacing used and the resistivity contrasts present in the subsurface. Investigation depth and resolution are inversely related—larger electrode spacings reach deeper but sacrifice spatial resolution. Surface conditions such as asphalt, concrete, or very dry soils can limit electrode contact and reduce data quality. Subsurface resistivity is influenced by multiple factors including moisture content, porosity, and pore fluid salinity, which can complicate the estimation of clay content. Conductive interference from fences, guardrails, buried utilities, and other metallic infrastructure can interfere with measurements. Single survey lines can be affected by off-line resistivity changes (3D effects), though this can be overcome by acquiring parallel survey lines. Edge effects resulting from reduced data density at survey line ends require surveys to extend beyond the area of interest. The resistivity models produced from ERI inversions should be calibrated with borehole data and laboratory testing to establish reliable resistivity-clay content relationships. Target detection depends on the combined factors of depth, size, and resistivity contrast—small clay lenses at great depth may be undetectable even with high resistivity contrast, while thin clay layers at shallow depth may be undetectable if the resistivity contrast with surrounding materials is insufficient.
Method

Electrical Resistivity Imaging